2021 CAEP Annual Report
The College of Education reports annually to the Council for the Accreditation of Educator Preparation (CAEP) on performance in areas of public interest including teaching effectiveness, employer satisfaction and employment milestones, completer satisfaction, graduation rates, licensing outcomes, employment outcomes, and consumer information.
Performance Measures
Impact on P-12 Learning and Development (4.1)
The college is in the planning phase of a project to collect data on the impact of our program completers on P-12 student learning and development.
Minnesota does not distribute value-added data.
College of Education Plan for Program Graduate Impact Study
Indicators of Teaching Effectiveness (4.2)
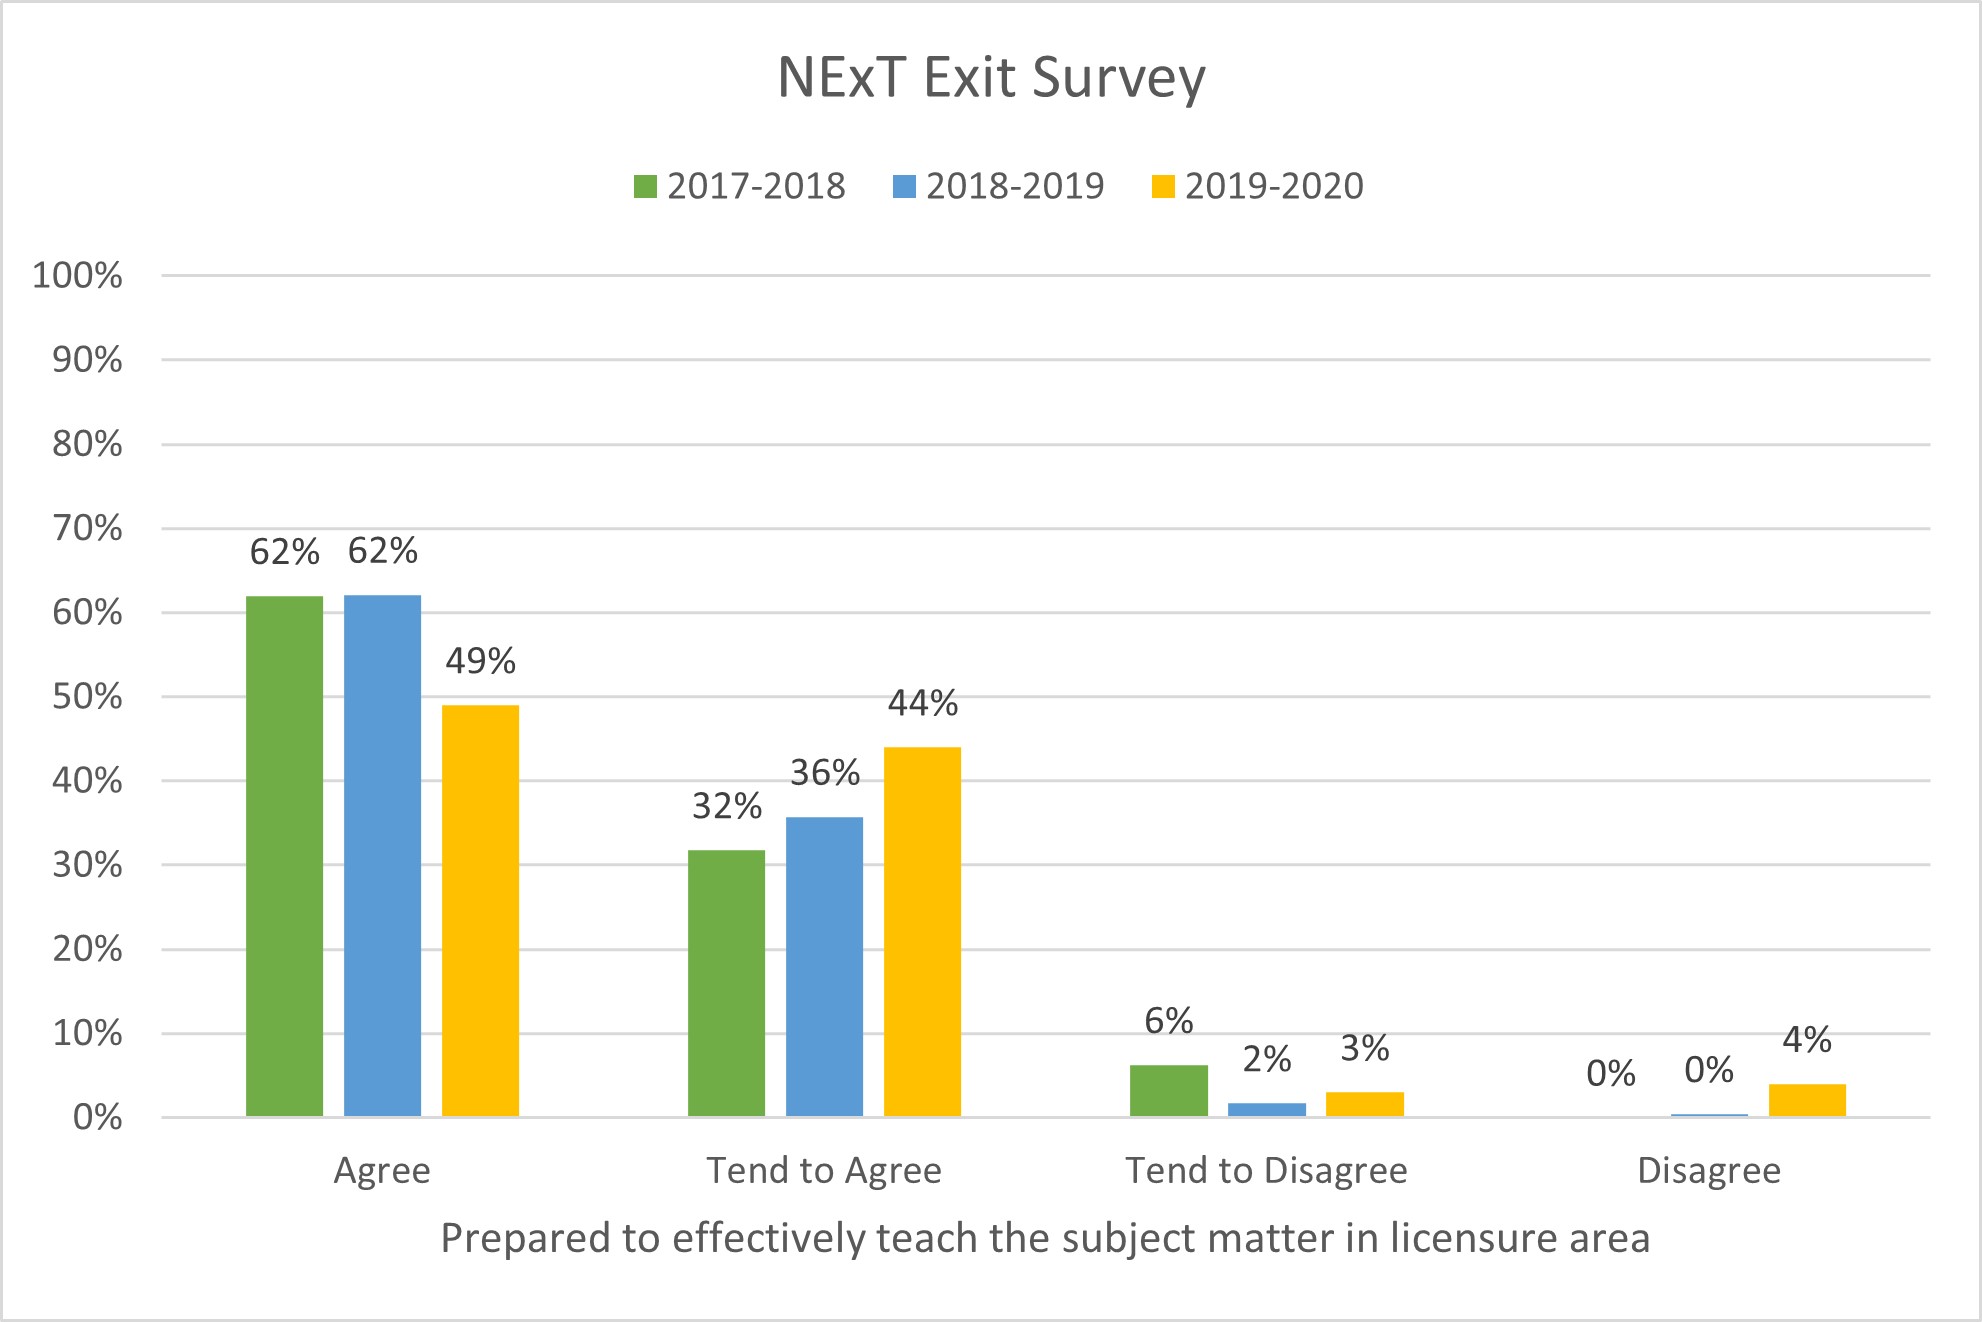
The college administers the Network for Excellence in Teaching (NExT) Exit Survey every fall and spring semester to candidates in their final student teaching semester. The chart linked below shows teacher candidate responses regarding their preparation to effectively teach in the subject matter in their license area
The NExT Exit Survey Responses chart includes responses from 2017-18, 2018-19, and 2019-20. In 2017-18, 62 percent agreed, 32 percent tended to agree, 6 percent tended to disagree, and 0 percent disagreed. In 2018-19, 62 percent agreed, 36 percent tended to agree, 2 percent tended to disagree, and 0 percent disagreed. In 2019-20, 49 percent agreed, 44 percent tended to agree, 3 percent tended to disagree, and 4 percent disagreed.
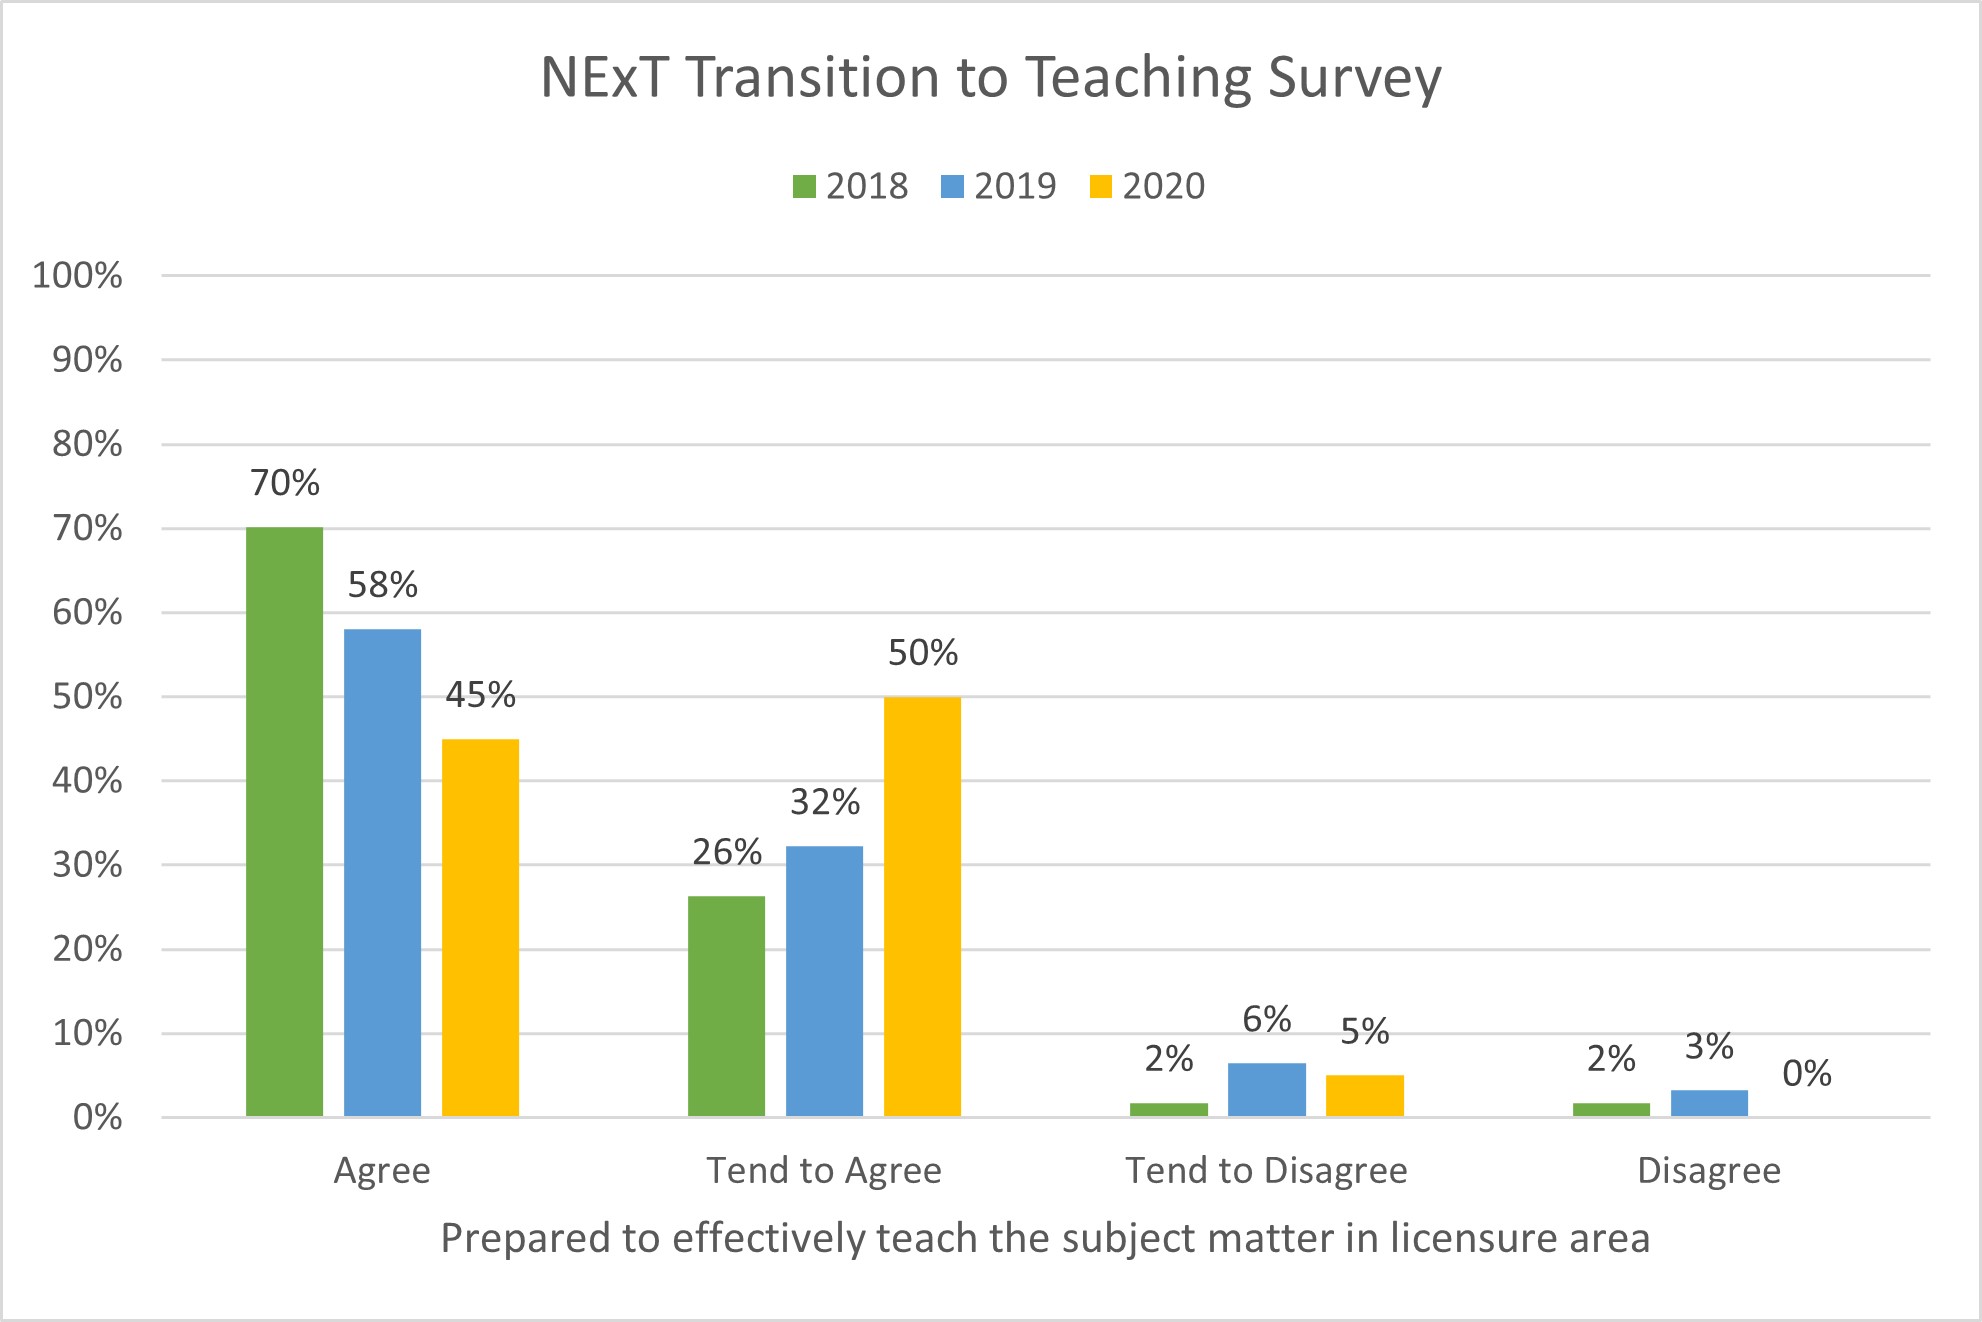
The college administers the Network for Excellence in Teaching (NExT) Transition to Teaching Survey to teacher preparation program alumni one year after completion. The NExT Transition to Teaching chart shows program alumni responses regarding their preparation to effectively teach in the subject matter in their license area.
NExT Transition to Teaching Responses
The chart includes responses from 2017-18, 2018-19, and 2019-20. In 2017-18, 70 percent agreed, 26 percent tended to agree, 2 percent tended to disagree, and 2 percent disagreed. In 2018-19, 58 percent agreed, 32 percent tended to agree, 6 percent tended to disagree, and 3 percent disagreed. In 2019-20, 45 percent agreed, 50 percent tended to agree, 5 percent tended to disagree, and 0 percent disagreed.
Satisfaction of Employers and Employment Milestones (4.3)
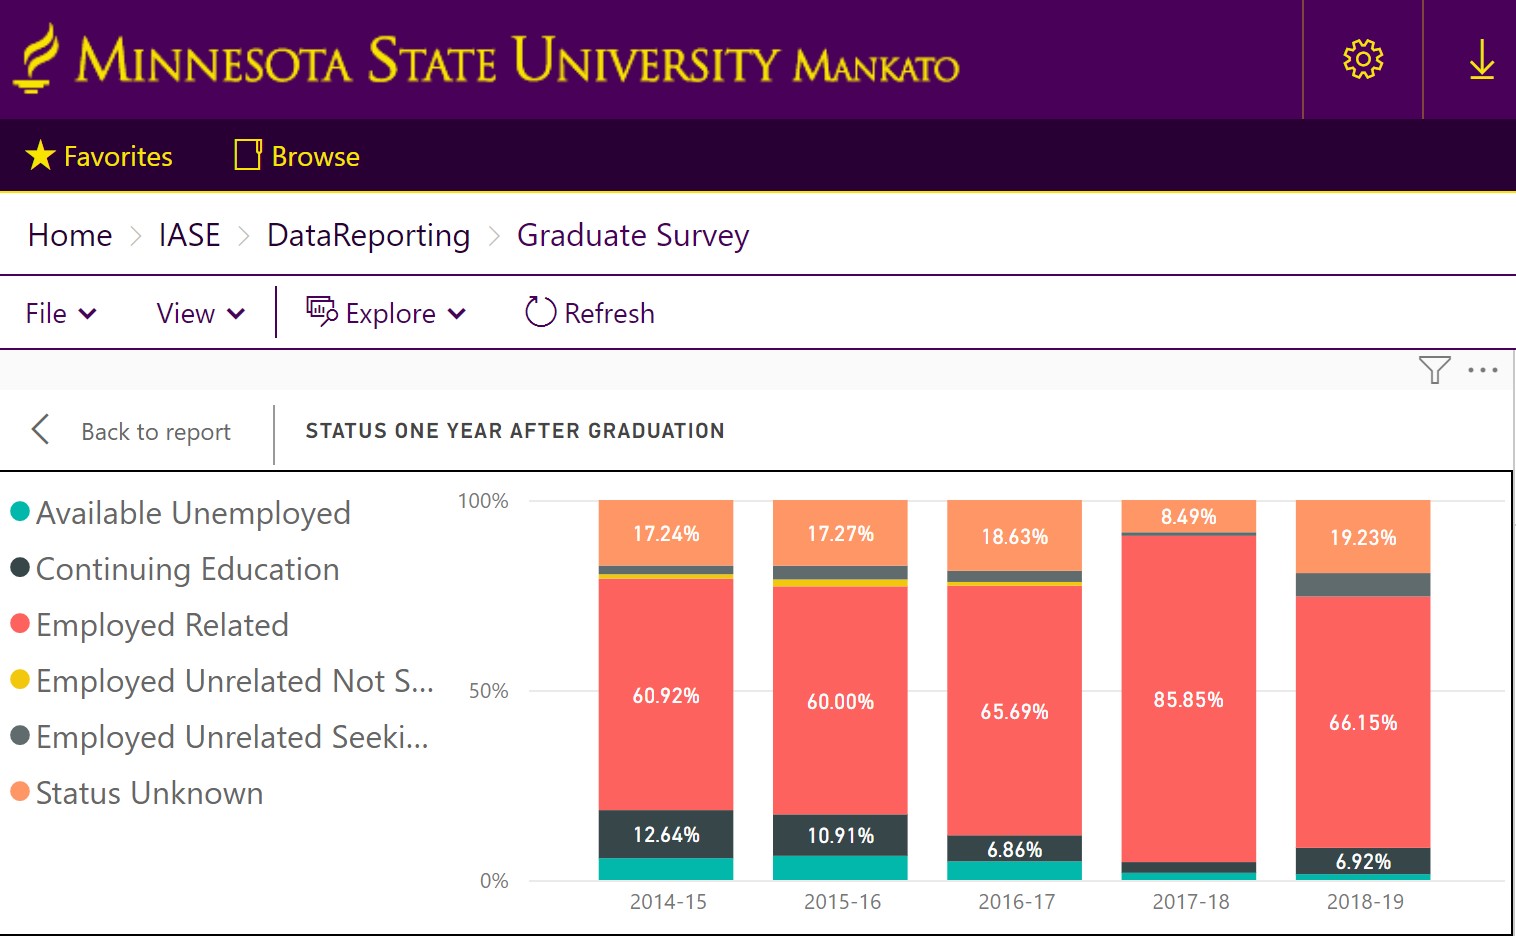
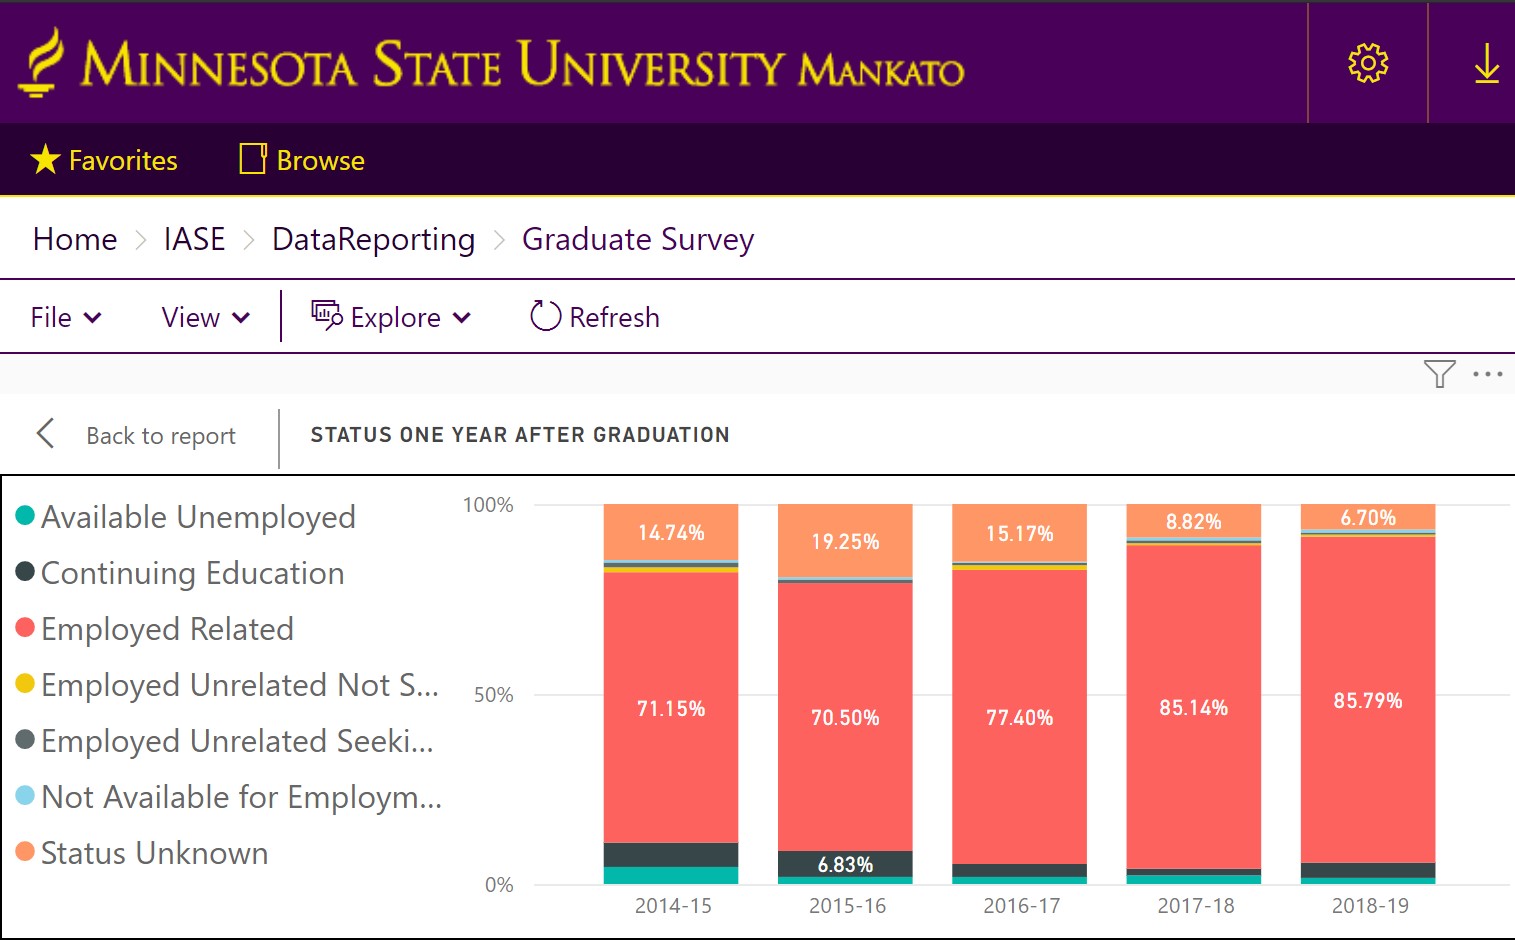
The university administers a Graduate Survey annually to program completers, which provides information on the employment status of graduates. The Employment Status of Undergraduate Program Alumni chart shows responses from undergraduates in the College of Education.
Employment Status of Undergraduate Program Alumni
The chart includes responses from 2014-15 to 2018-19 and shows that the majority of graduates were employed in a job related to their degree. In 2014-15, 71.1 percent; 2015-16, 70.5 percent; 2016-17, 77.4 percent, 2017-18, 85.1 percent; 2018-19, 85.7 percent were employed in a related field.
The chart below shows responses from graduate program alumni.
Employment Status of Graduate Program Alumni
The chart includes responses from 2014-15 to 2018-19 and shows that the majority of graduates were employed in a job related to their degree. In 2014-15, 60.9 percent; 2015-16, 60 percent; 2016-17, 65.7 percent, 2017-18, 85.8 percent; 2018-19, 66.1 percent were employed in a related field.
The college also administers the Network for Excellence in Teaching (NExT) Supervisor Survey to supervisors (principals, assistant principals) of alumni completing their first year in the classroom. Due to extenuating circumstances during the 2019-2020 academic year, the college did not administer the Supervisor Survey. Supervisor Survey administration will resume May 2021.
Results from the 2020 Supervisor Survey
Satisfaction of Completers (4.4)
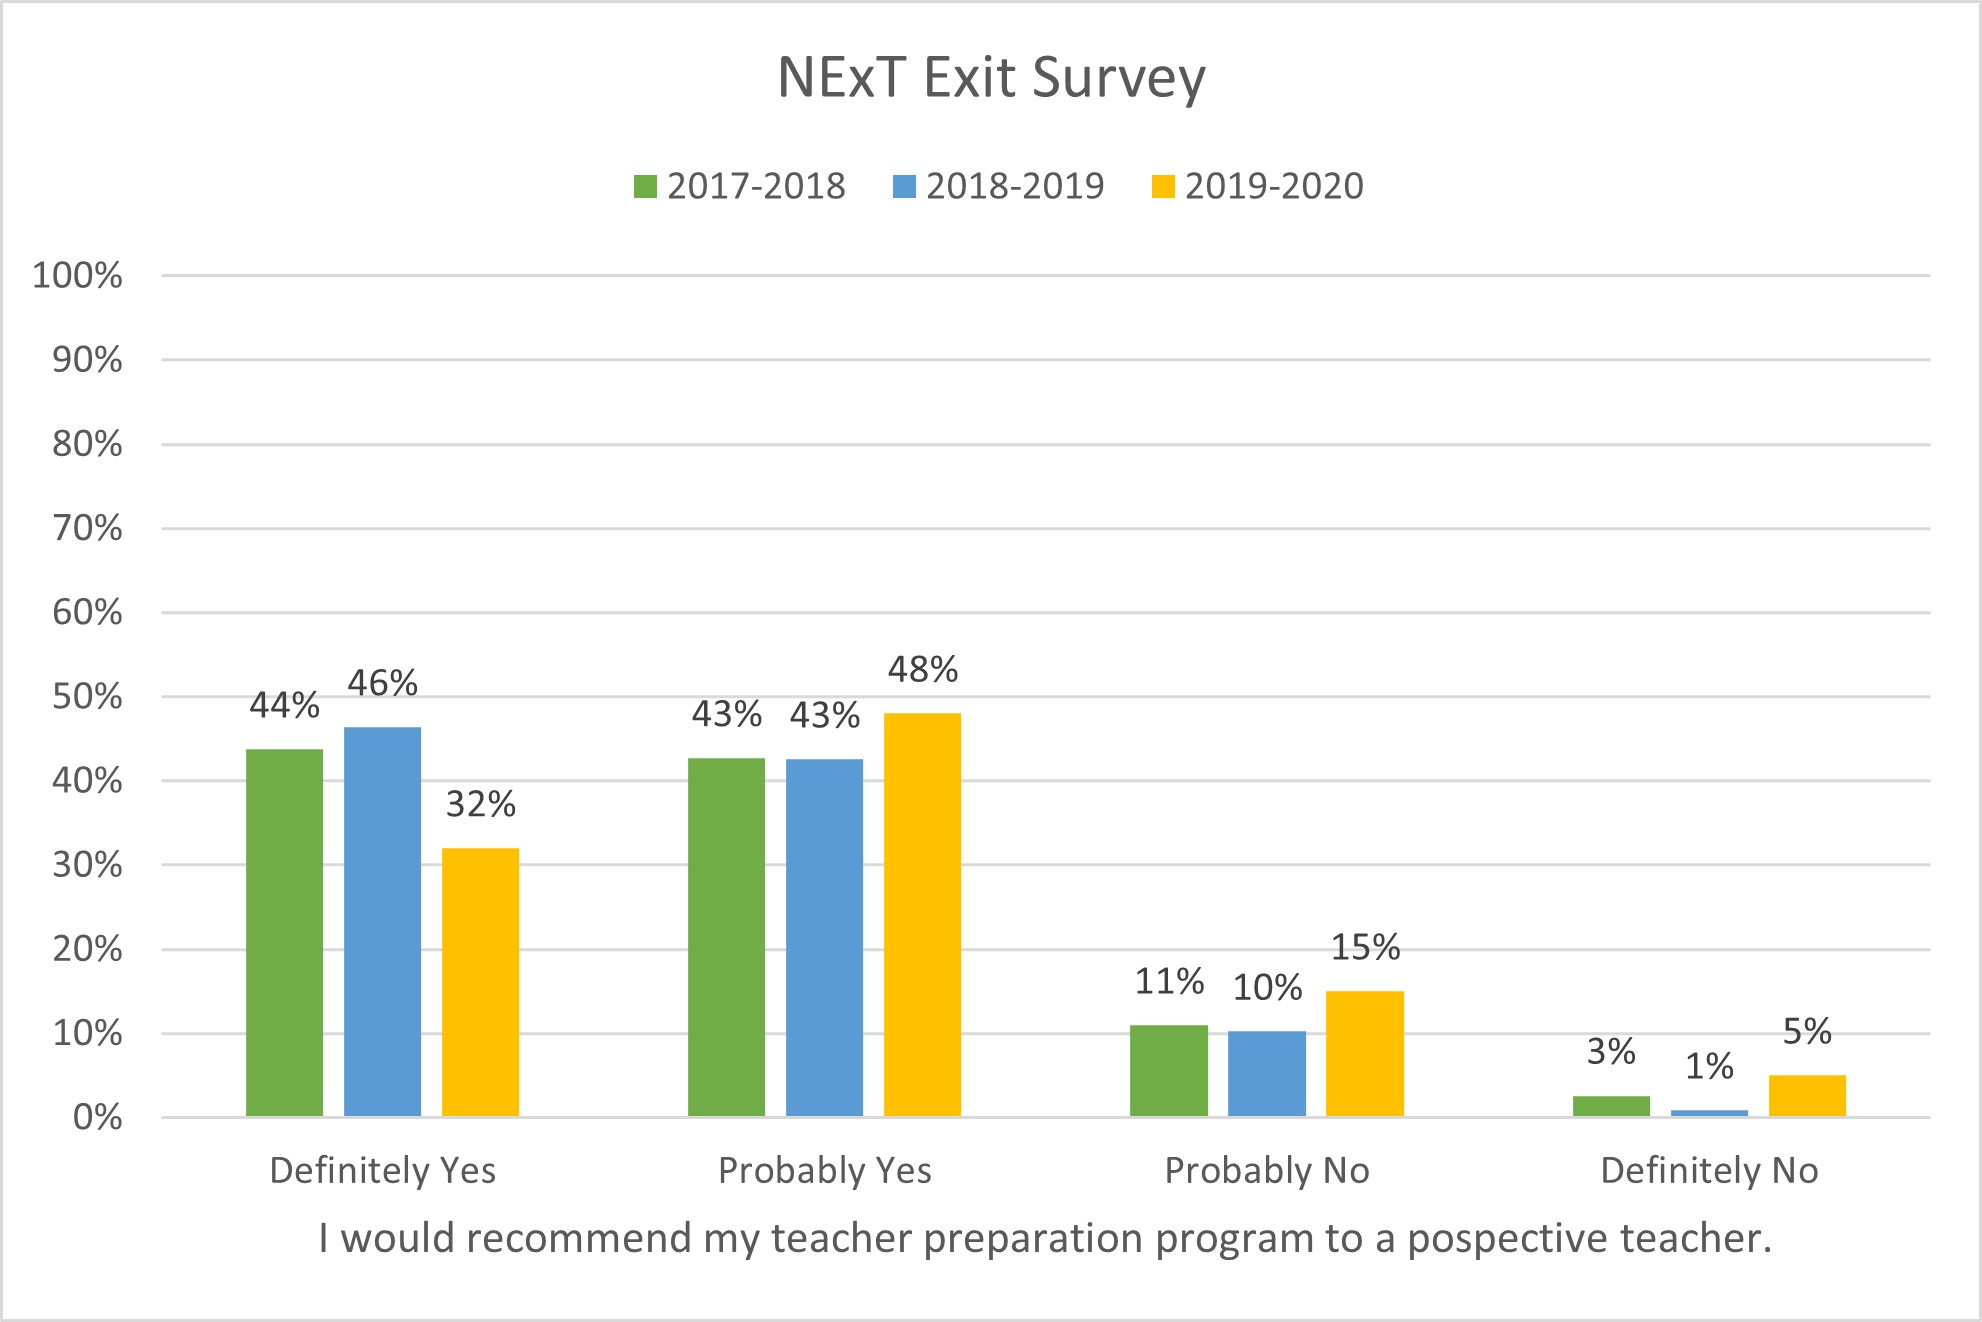
The college administers the Network for Excellence in Teaching (NExT) Exit Survey each fall and spring semester to candidates in their final student teaching semester. The NExT Exit Survey chart shows teacher candidate responses on whether they would recommend their teacher preparation program to a prospective teacher.
The chart includes responses from 2017-18, 2018-19, and 2019-20. In 2017-18, 44 percent agreed, 43 percent tended to agree, 11 percent tended to disagree, and 3 percent disagreed. In 2018-19, 46 percent agreed, 43 percent tended to agree, 10 percent tended to disagree, and 1 percent disagreed. In 2019-20, 32 percent agreed, 48 percent tended to agree, 15 percent tended to disagree, and 5 percent disagreed.
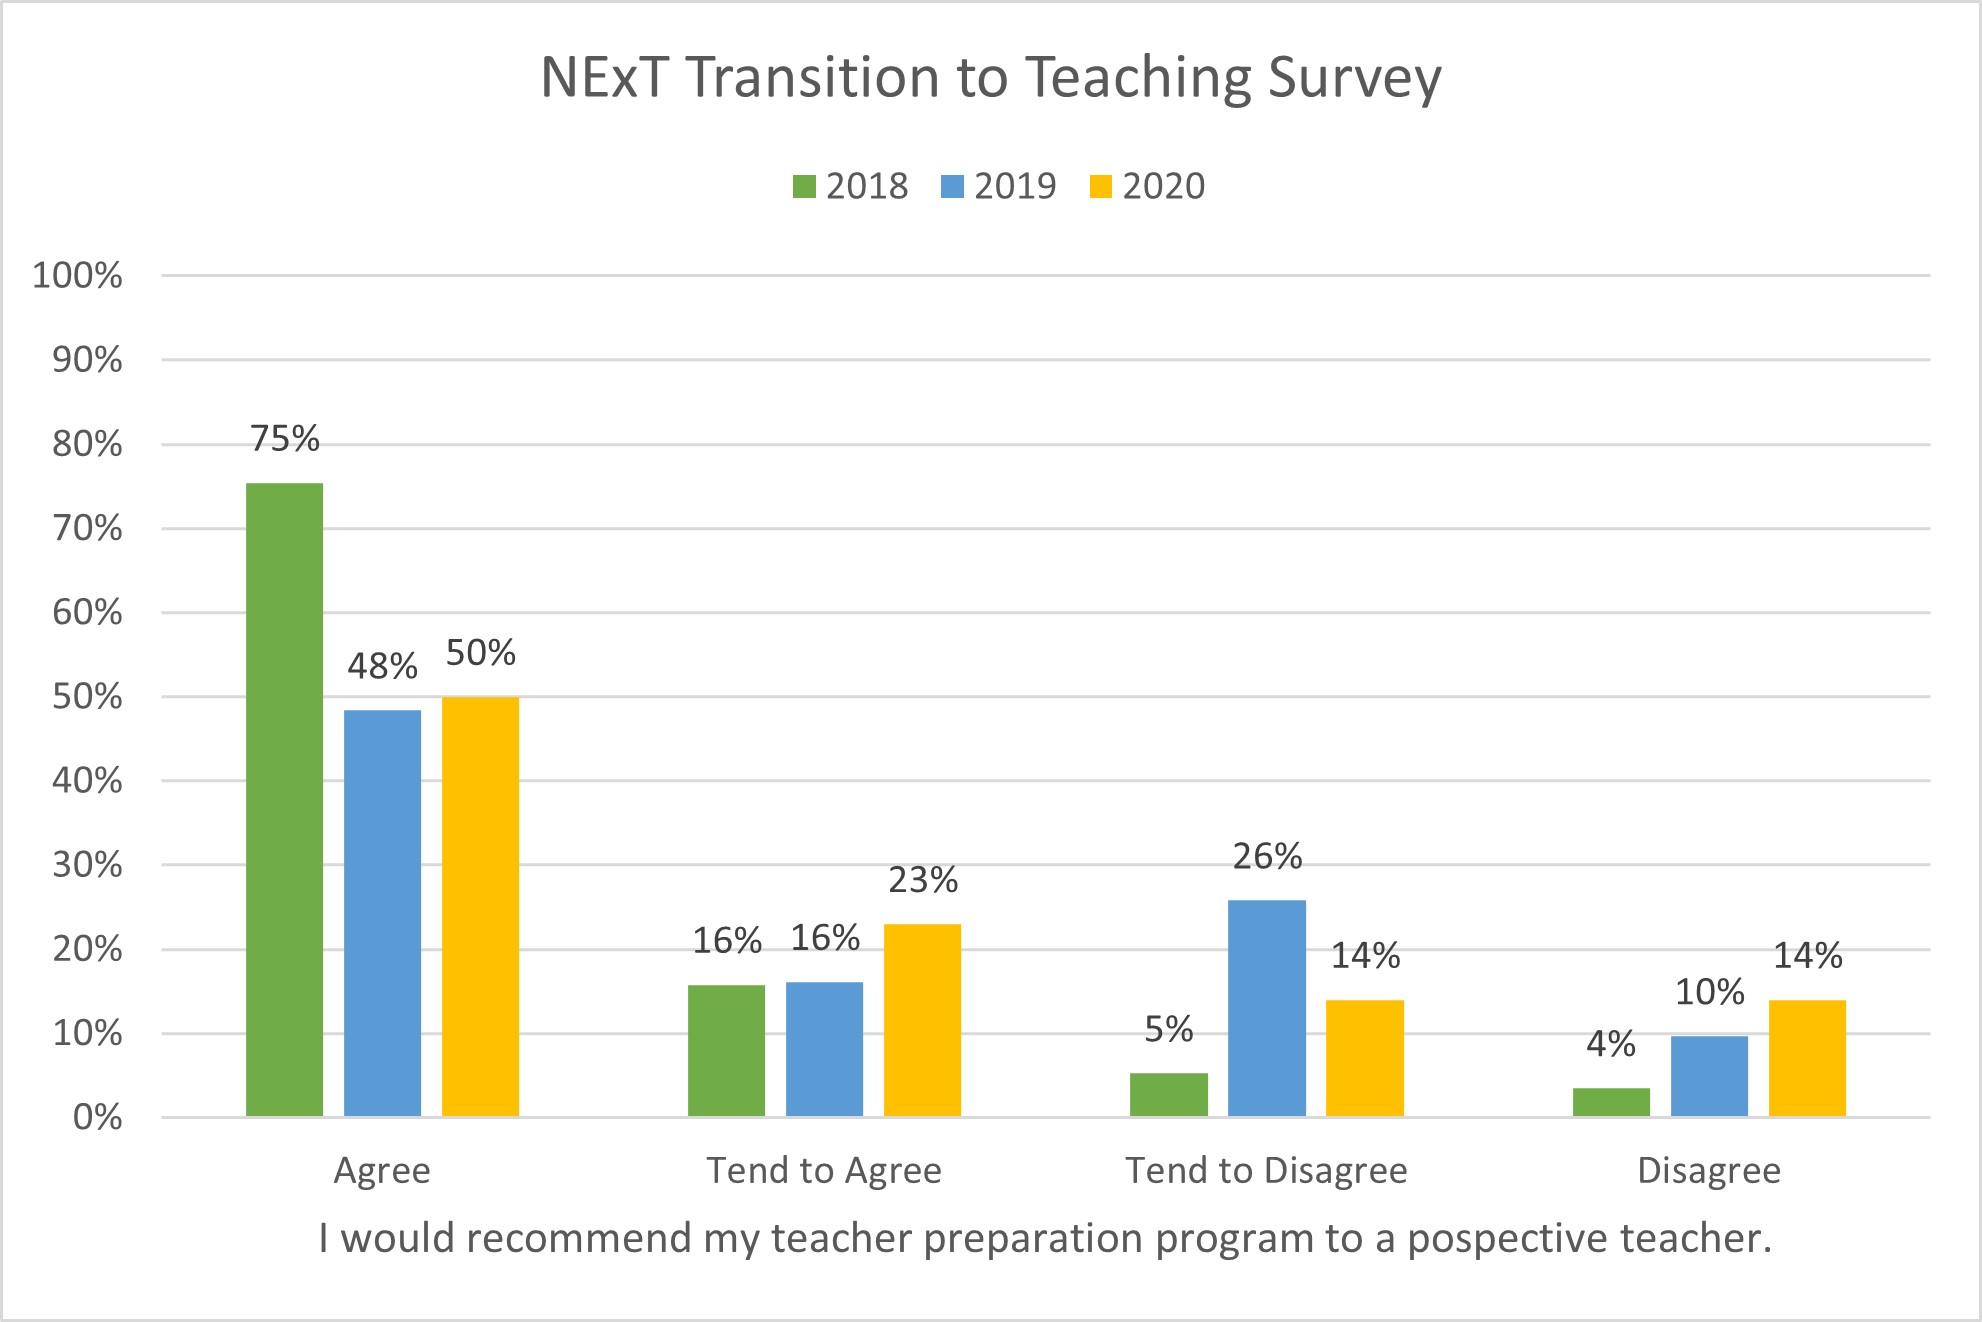
The college administers the Network for Excellence in Teaching (NExT) Transition to Teaching Survey to teacher preparation program alumni one year after completion. The NExT Transition to Teaching Responses chart shows program completer responses on whether they would recommend their teacher preparation program to a prospective teacher.
NExT Transition to Teaching Responses
The chart includes responses from 2017-18, 2018-19, and 2019-20. In 2017-18, 75 percent agreed, 16 percent tended to agree, 5 percent tended to disagree, and 4 percent disagreed. In 2018-19, 48 percent agreed, 16 percent tended to agree, 26 percent tended to disagree, and 10 percent disagreed. In 2019-20, 50 percent agreed, 23 percent tended to agree, 14 percent tended to disagree, and 14 percent disagreed.
Graduation Rates
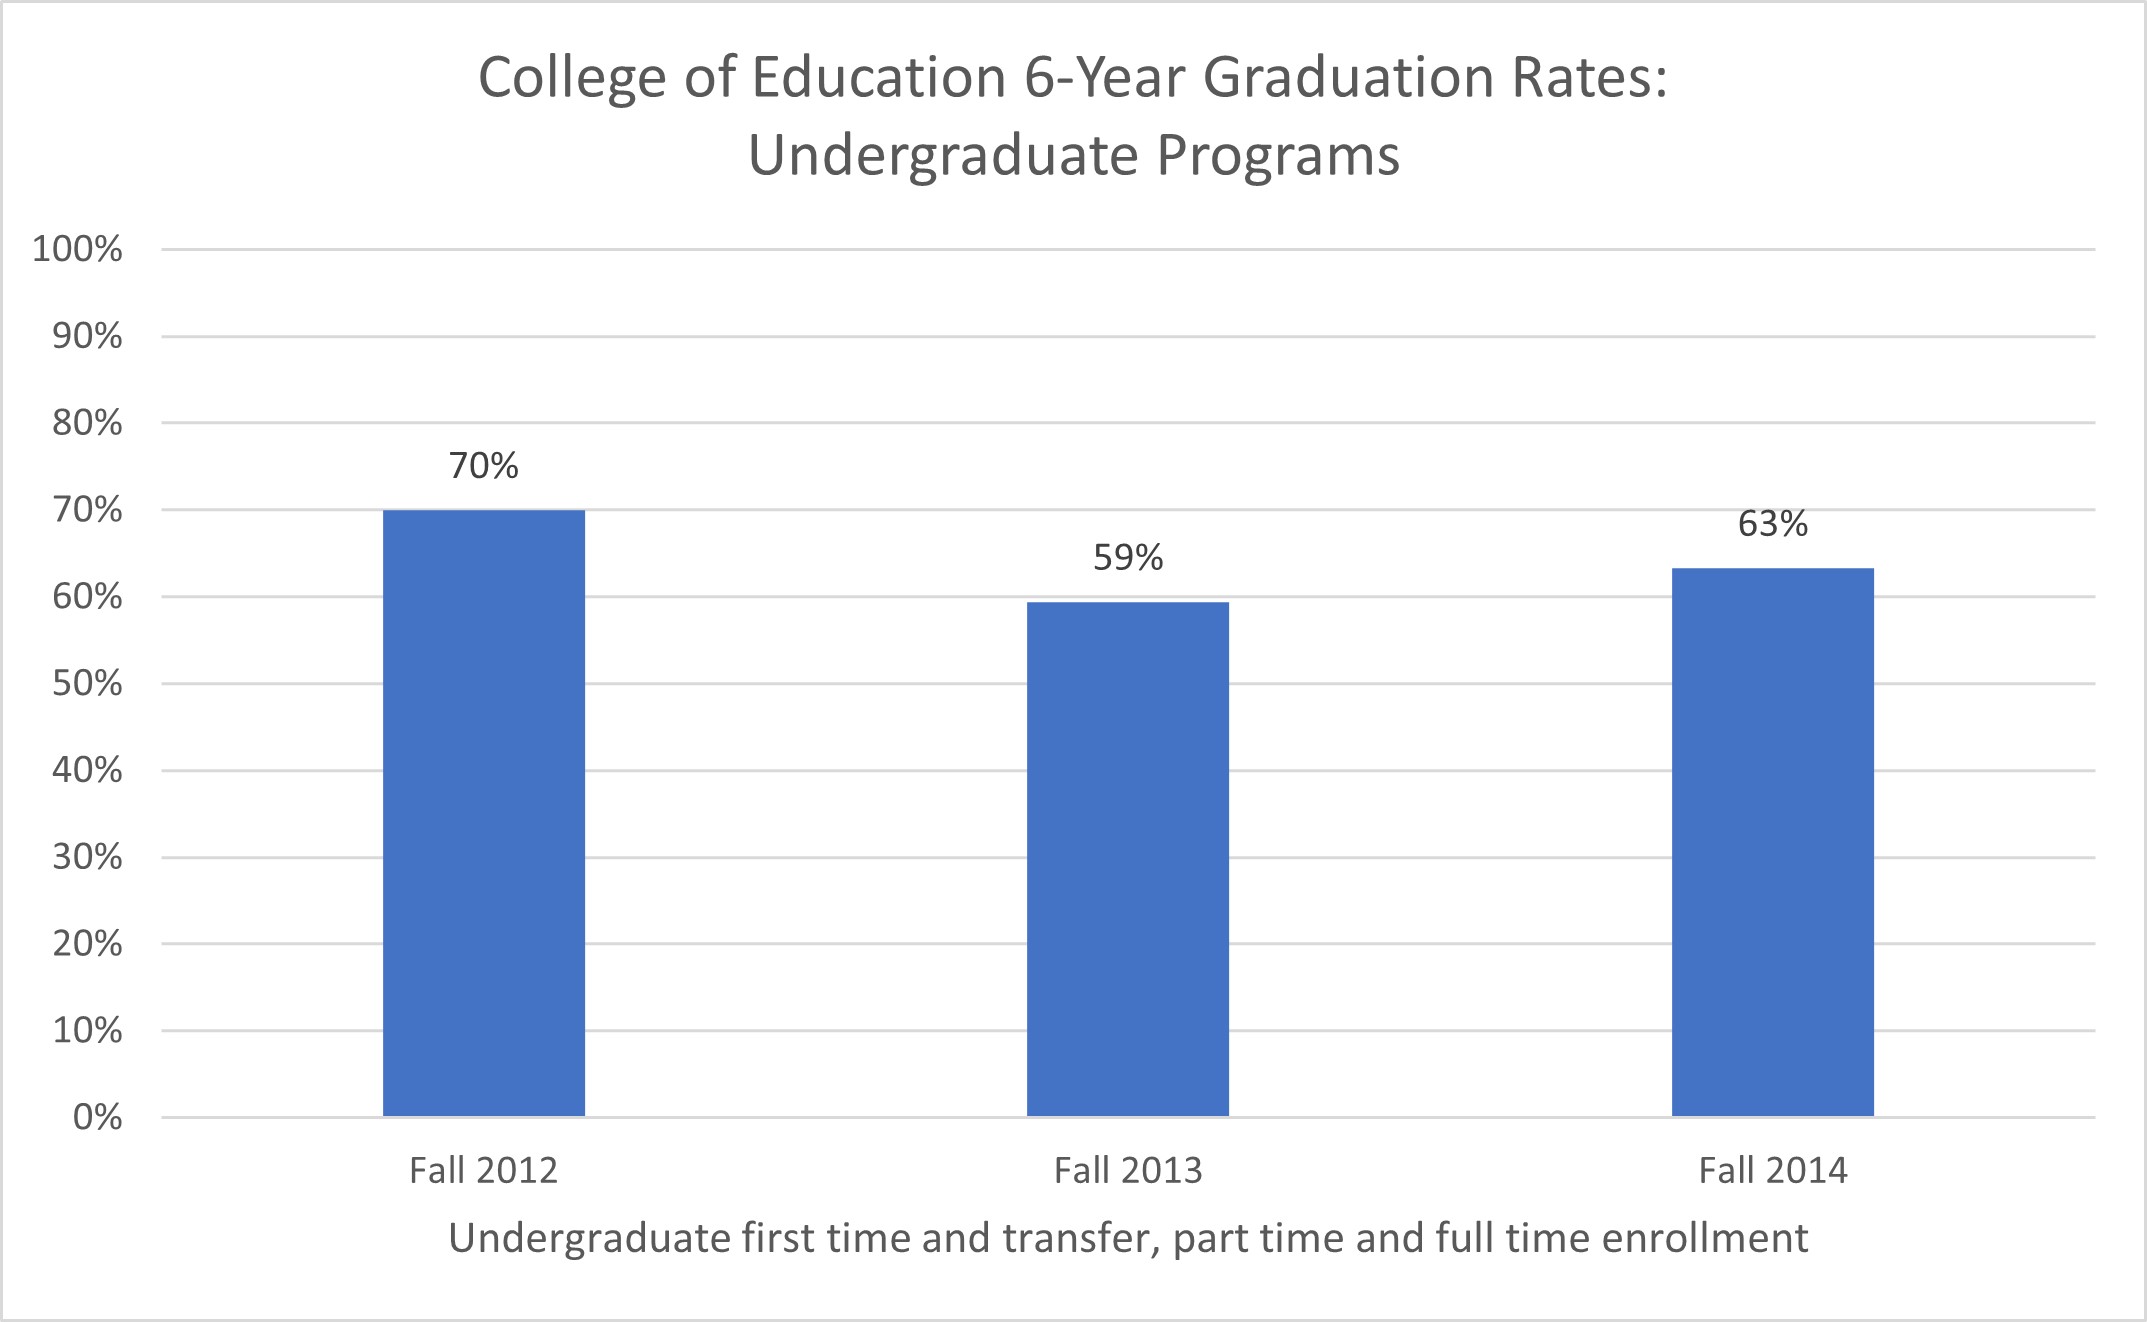
The university collects and distributes data on undergraduate and graduate program completion rates. The Undergraduate 6-Year Graduation Rates chart shows graduation rates for undergraduate, first-time and transfer students enrolled part time and full time in College of Education majors (excluding Aviation).
Undergraduate 6-Year Graduation Rates
The six-year graduation rate was 70 percent for students entering Fall 2012; 59 percent for students entering Fall 2013; and 63 percent for students entering Fall 2014.
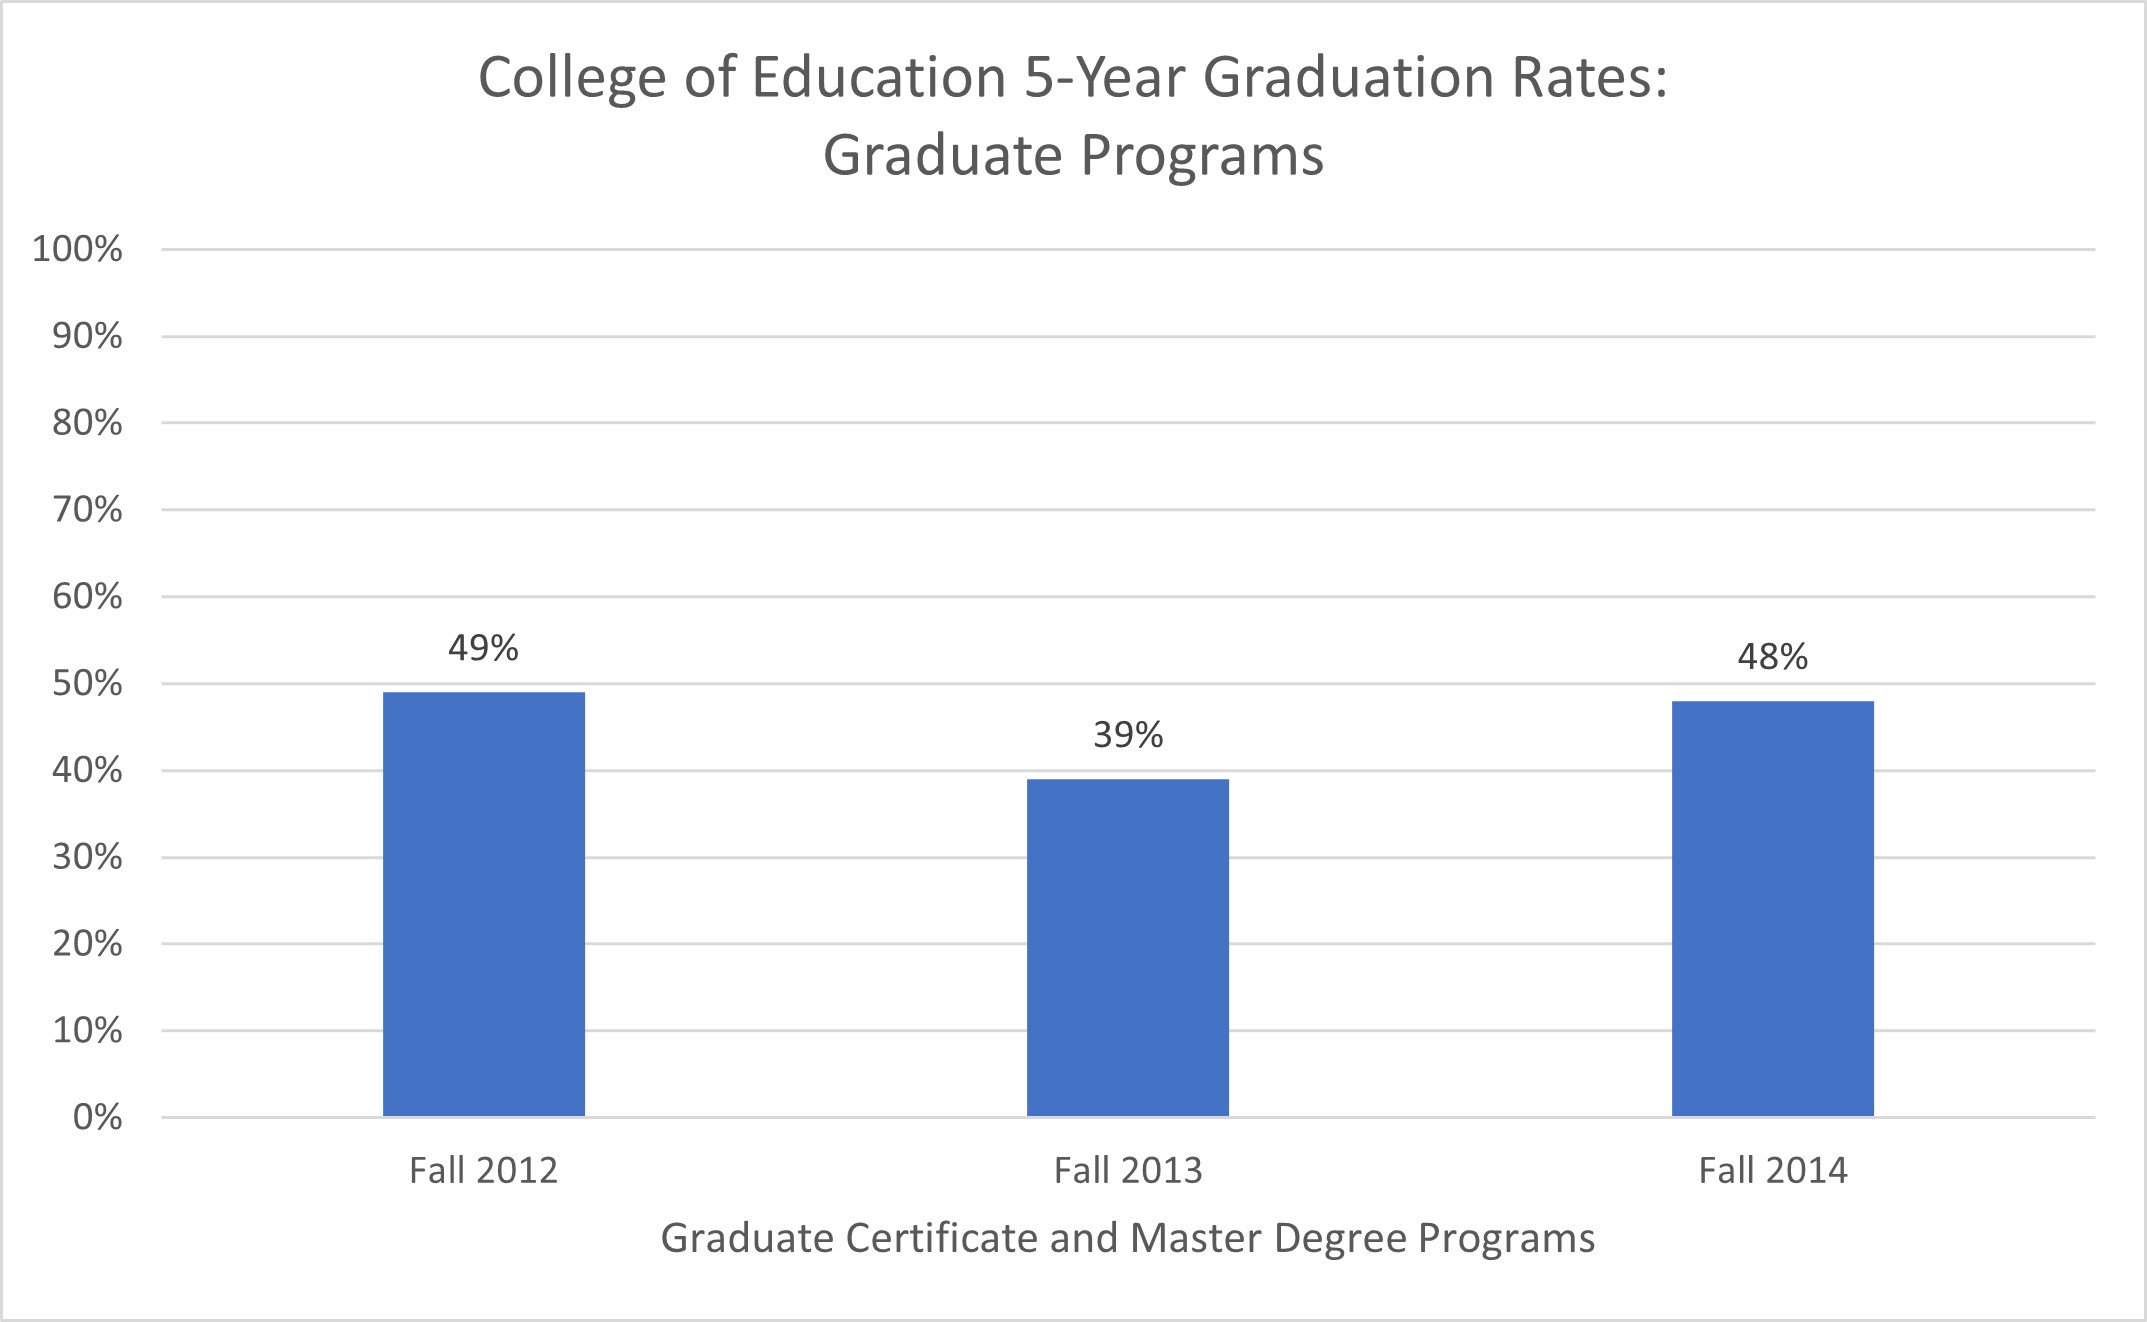
The Graduate 5-Year Graduation Rates chart shows graduation rates for students enrolled in graduate certificate and master degree programs in the College of Education.
Graduate 5-Year Graduation Rates
The six-year graduation rate was 49 percent for students entering Fall 2012; 39 percent for students entering Fall 2013, and 48 percent for students entering Fall 2014.
Ability of Completers to Meet Licensing Requirements
The college monitors pass rates on state content and pedagogy assessments required for licensure. The Assessment Pass Rates links show pass rates by test and overall for three years of completers and for currently enrolled students. Please note, for data privacy purposes, pass rates for groups smaller than 10 are not included.
Assessment Pass Rates Traditional Programs
The summary pass rates for traditional teacher licensure programs were 80 percent in 2019-20, 84 percent in 2018-19, and 92 percent in 2017-18.
Assessment Pass Rates Alternative Programs
The summary pass rates for nontraditional teacher licensure programs (Health and Physical Education dual) were not reported beacuse the number of testers was under 10.
Ability of Completers to Be Hired in Education Positions for which They Have Been Prepared
The university administers a Graduate Survey to annually to program completers. From this survey, we gather information on the employment status of graduates from College of Education undergraduate and graduate programs. The Employment Status of Undergraduate Program Alumni chart shows responses from undergraduates.
Employment Status of Undergraduate Program Alumni
The chart includes responses from 2014-15 to 2018-19 and shows that the majority of graduates were employed in a job related to their degree. In 2014-15, 71.1 percent; 2015-16, 70.5 percent; 2016-17, 77.4 percent, 2017-18, 85.1 percent; 2018-19, 85.7 percent were employed in a related field.
The chart below shows responses from graduate program alumni.
Employment Status of Graduate Program Alumni
The chart includes responses from 2014-15 to 2018-19 and shows that the majority of graduates were employed in a job related to their degree. In 2014-15, 60.9 percent; 2015-16, 60 percent; 2016-17, 65.7 percent, 2017-18, 85.8 percent; 2018-19, 66.1 percent were employed in a related field.
Consumer Information
The university publishes up-to-date cost of attendance for undergraduate and graduate programs on the Financial Aid website.
Federal Loan Default Rates