2019 CAEP Accreditation Annual Report
The College of Education reports annually to the Council for the Accreditation of Educator Preparation (CAEP) on performance in areas of public interest including teaching effectiveness, employer satisfaction and employment milestones, completer satisfaction, graduation rates, licensing outcomes, employment outcomes, and consumer information. The graphs and data below show performance in those areas.
Indicators of Teaching Effectiveness
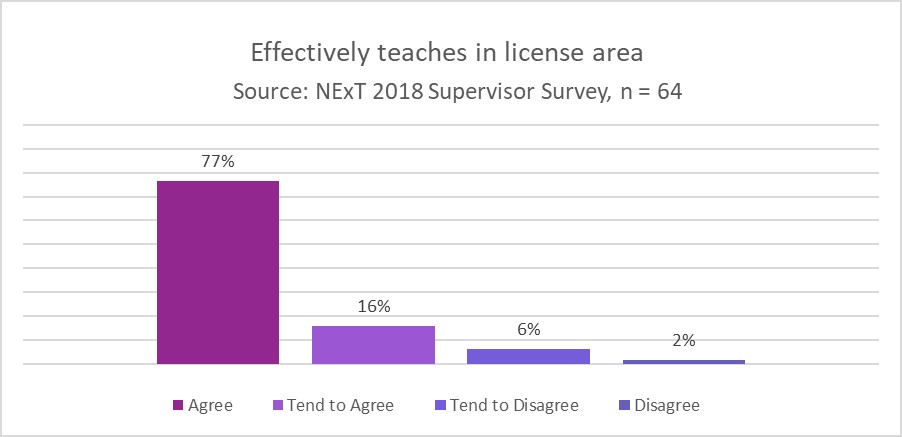
Network for Excellence in Teaching Supervisor Survey 2018
Sixty-four supervisors responded. Seventy-seven percent agreed that new teachers effectively teach in their license area, sixteen percent tended to agree, six percent tended to disagree, and two percent disagreed.
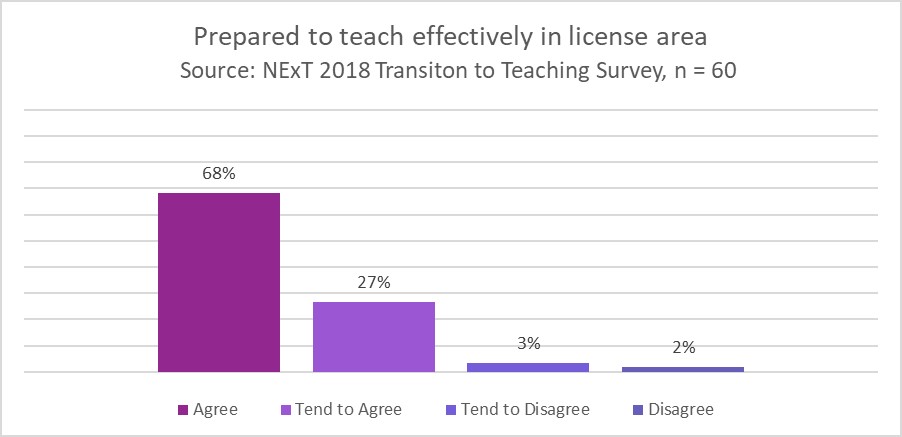
Network for Excellence in Teaching Transition to Teaching Survey 2018
Sixty new teachers responded. Sixty-eight percent agreed that their program prepared them to teach effectively in their license area, twenty-seven percent tended to agree, three percent tended to disagree, and two percent disagreed.
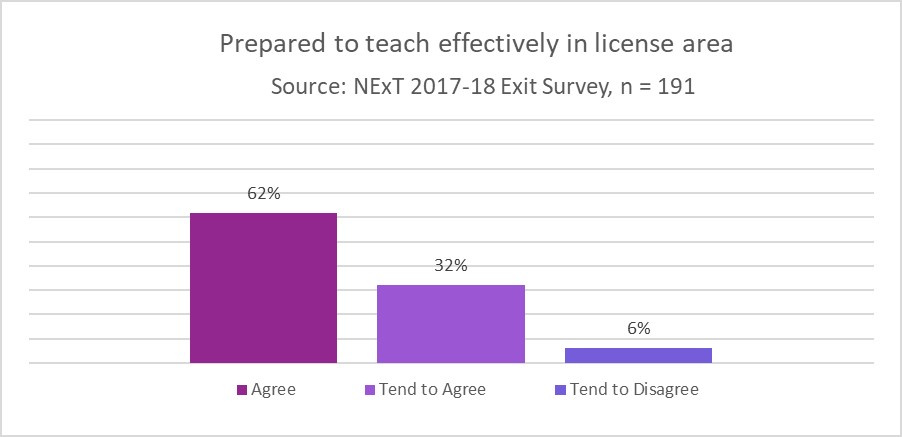
Network for Excellence in Teaching Exit Survey 2017-2018
One hundred ninety-one student teachers responded. Sixty-two percent agreed that their program prepared them to teach effectively in their license area, thirty-two percent tended to agree, and six percent tended to disagree.
Employer Satisfaction and Employment Milestones
Network for Excellence in Teaching Exit Survey 2017-2018
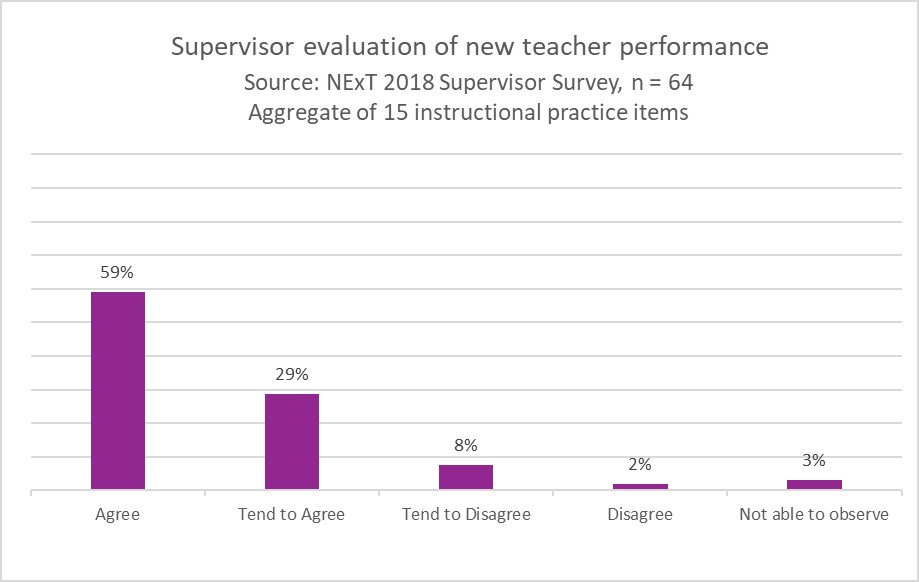
Sixty-four supervisors responded. Fifty-nine percent agreed that new teachers were prepared effectively across 15 instructional practice survey items, twenty-nine tended to agree, eight percent tended to disagree, and two percent disagreed. Three percent were unable to observe.
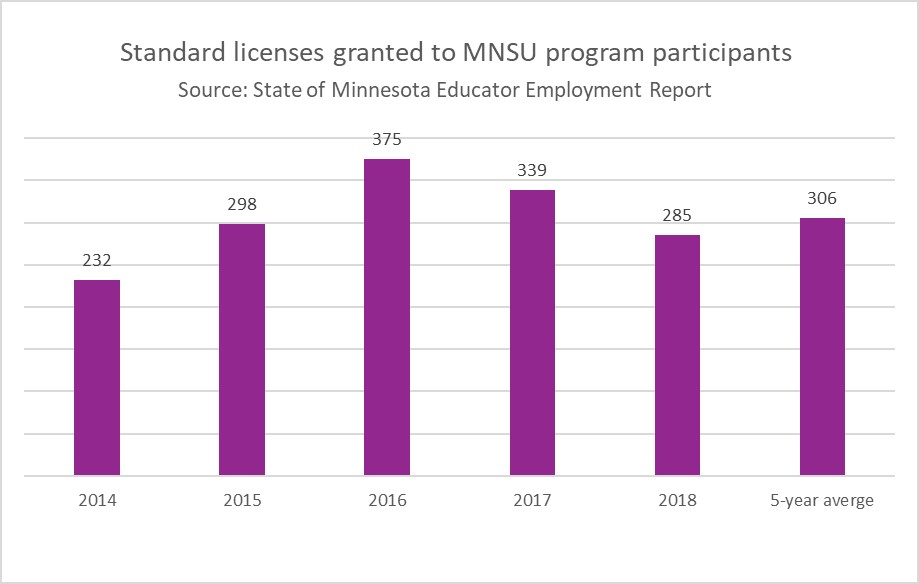
Professional Educator Licensing and Standards Board Educator Employment Report
Number of standard licenses granted to alumni. In 2014, two-hundred and thirty-two. 2015: two-hundred and ninety-eight. 2016: three-hundred and seventy-five. 2017: three-hundred and thirty-nine. 2018: two-hundred and eighty-five. Five-year average: three-hundred and six.
Completer Satisfaction
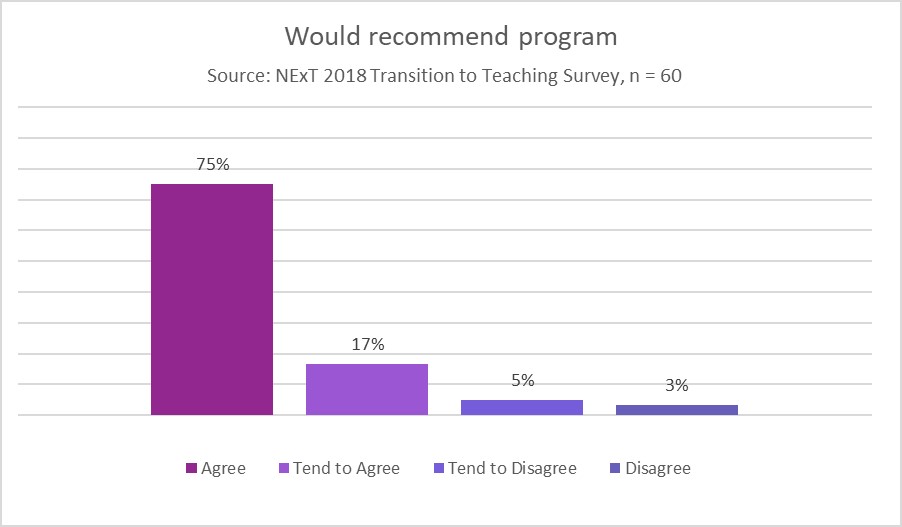
Network for Excellence in Teaching Transition to Teaching Survey 2018
Sixty new teachers responded. Seventy-five percent agreed that they would recommend their preparation program, seventeen percent tended to agree, five percent, tended to disagree, and three percent disagreed.
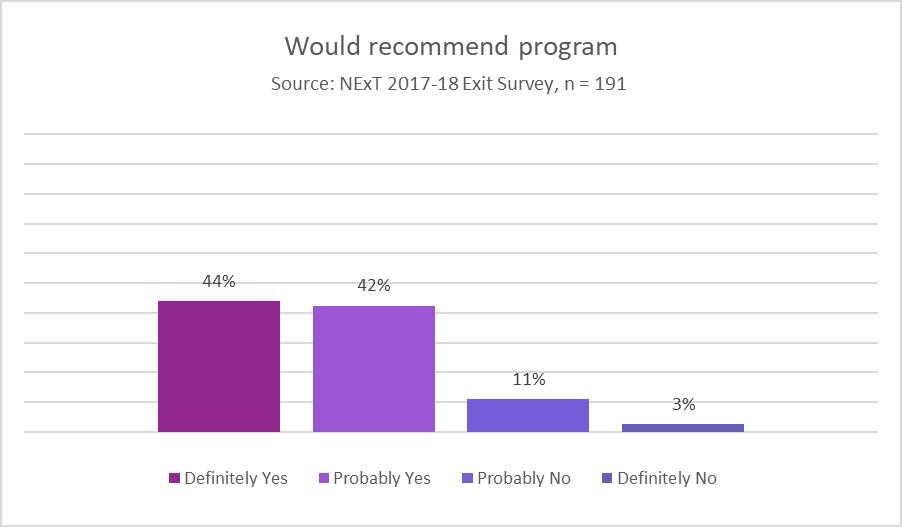
Network for Excellence in Teaching Exit Survey 2017-2018
One-hundred ninety-one teacher candidates responded. Forty-four percent indicated definitely yes, they would recommend their preparation program; forty-two percent indicated probably yes; eleven percent indicated probably no, and three percent indicated definitely no.
Graduation Rates
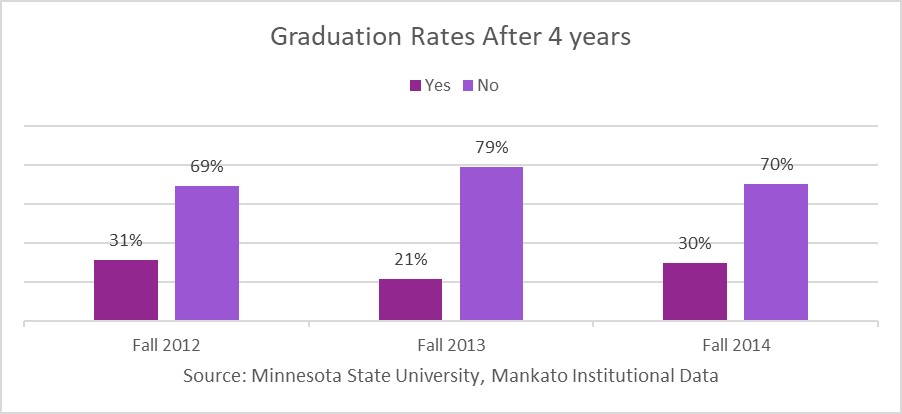
College of Education graduation rates after four years for three entering terms: Fall 2012: thirty-one percent. Fall 2013: twenty-one percent. Fall 2014: thirty percent. Minnesota State University, Mankato institutional data.
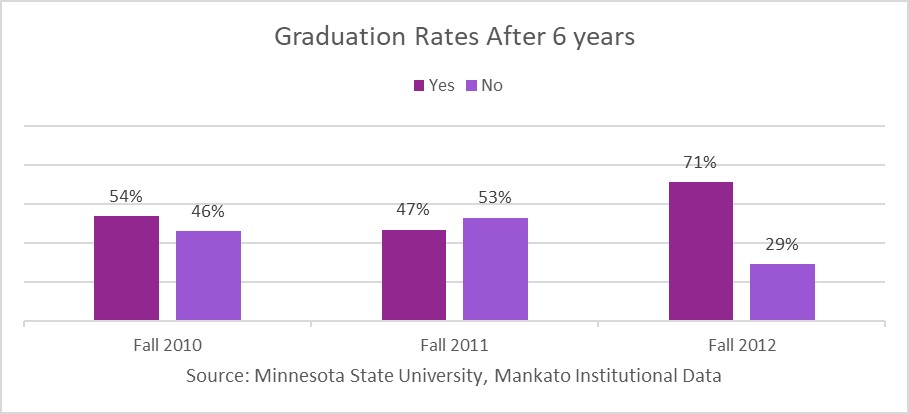
College of Education graduation rates after six years for three entering terms: Fall 2010 = fifty-four percent. Fall 2011: forty-seven percent. Fall 2012: seventy-one percent. Minnesota State University, Mankato institutional data.
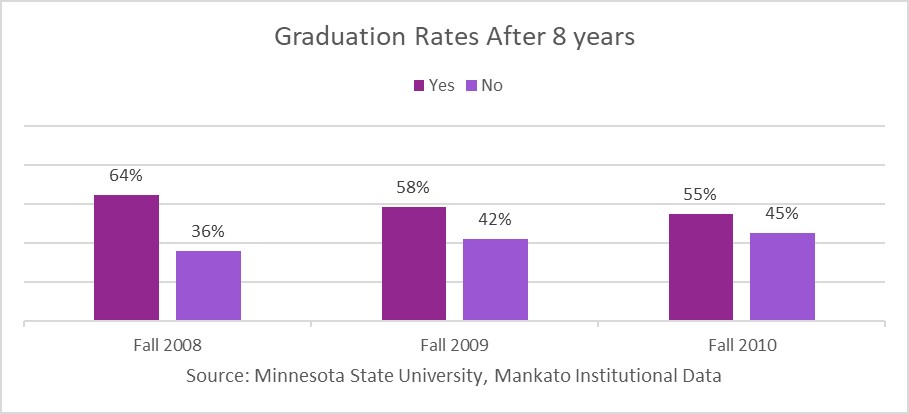
College of Education graduation rates after eight years for three entering terms: Fall 2008 = sixty-four percent. Fall 2009: fifty-eight percent. Fall 2010: fifty-five percent. Minnesota State University, Mankato institutional data.
Ability to Meet Licensing Requirements
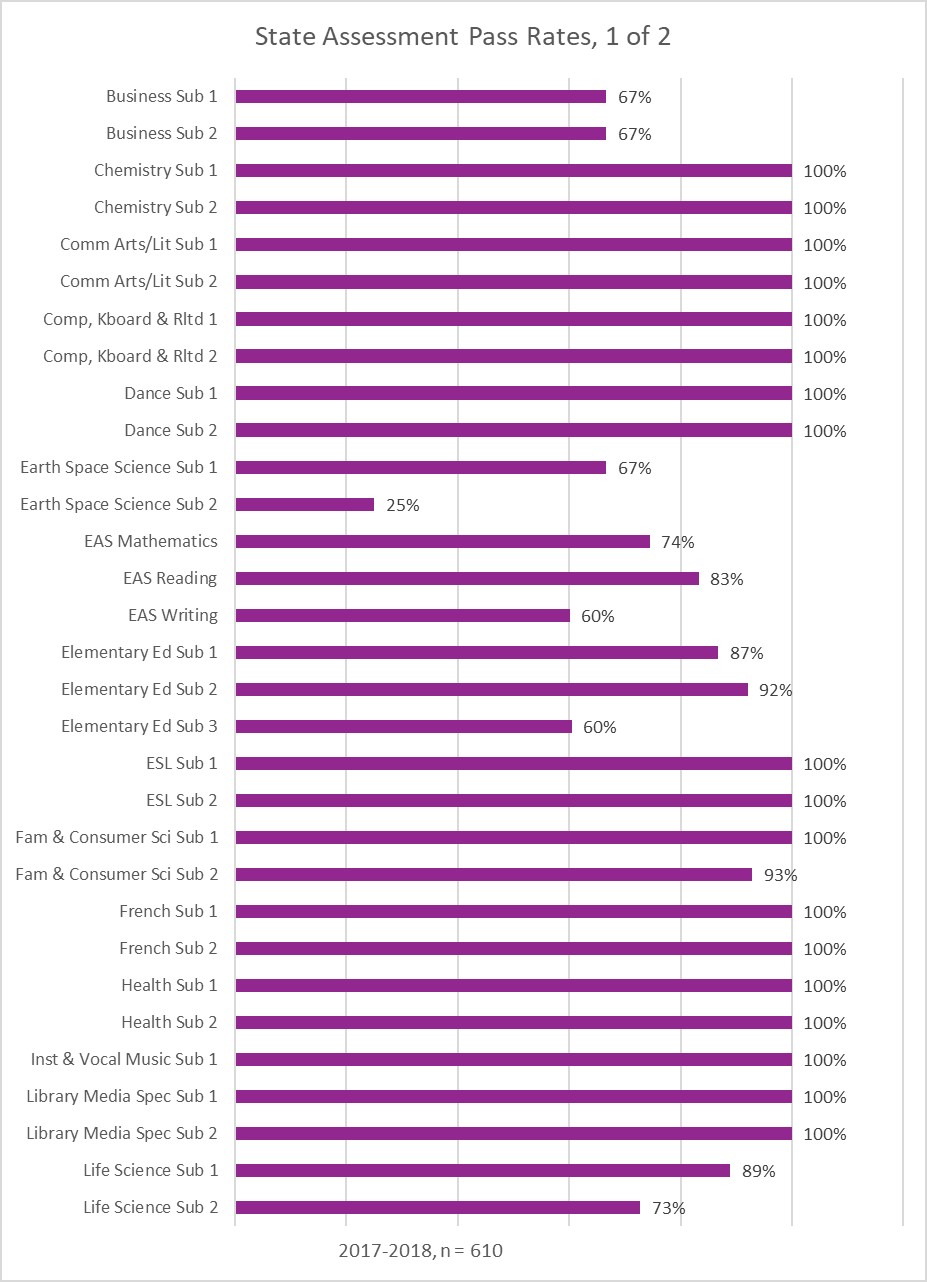
State Assessment Pass Rates, 1 of 2.
Six-hundred and ten students attempted one or more Subtest in one or more of twenty-nine content areas evaluated by the Minnesota Teacher Licensure Exam (MTLE):
Business Subtest 1: Sixty-seven percent passed. Business Subtest 2: Sixty-seven percent passed.
Chemistry Subtest 1: One-hundred percent passed. Chemistry Subtest 2: One-hundred percent passed.
Communication Arts/Lit Subtest 1: One-hundred percent passed. Communication Arts/Lit Subtest 2: One-hundred percent passed.
Computer, Keyboard & Related: 1: One-hundred percent passed. Computer, Keyboard & Related 2: One-hundred percent passed.
Dance Subtest 1: One-hundred percent passed. Dance Subtest 2: One-hundred percent passed.
Earth Space Science Subtest 1: Sixty-seven percent passed. Earth Space Science Subtest 2: Twenty-five percent passed.
EAS Mathematics: Seventy-four percent passed. EAS Reading: Eighty-three percent passed. EAS Writing: Sixty percent passed.
Elementary Education Subtest 1: Eighty-seven percent passed. Elementary Education Subtest 2: Ninety-two percent passed. Elementary Education Subtest 3: Sixty percent passed.
ESL Subtest 1: One-hundred percent passed. ESL Subtest 2: One-hundred percent passed.
Family & Consumer Science Subtest 1: One-hundred percent passed. Family & Consumer Science Subtest 2: Ninety-three percent passed.
French Subtest 1: One-hundred percent passed. French Subtest 2: One-hundred percent passed.
Health Subtest 1: One-hundred percent passed. Health Subtest 2: One-hundred percent passed.
Instrumental & Vocal Music Subtest 1: One-hundred percent passed.
Library Media Spec Subtest 1: One-hundred percent passed. Library Media Spec Subtest 2: One-hundred percent passed.
Life Science Subtest 1: Eighty-nine percent passed. Life Science Subtest 2: Seventy-three percent passed.
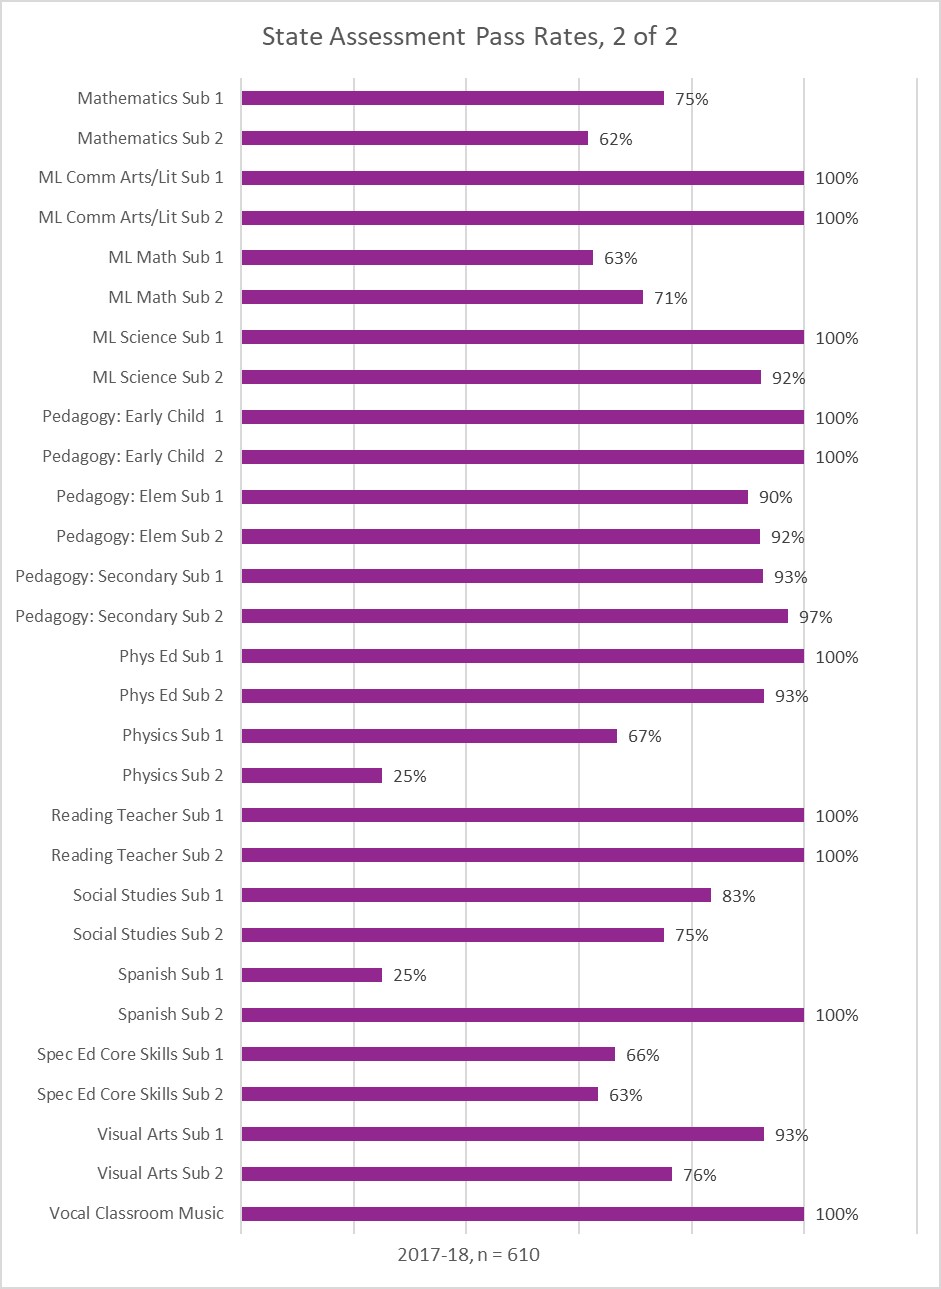
State Assessment Pass Rates, 2 of 2
Mathematics Subtest 1: Seventy-five percent passed. Mathematics Subtest 2: Sixty-two percent passed.
Mid-level Communication Arts/Literature Subtest 1: One-hundred percent passed. Mid-level Communication Arts/Literature Subtest 2: One-hundred percent passed.
Mid-level Math Subtest 1: Sixty-three percent passed. Mid-level Math Subtest 2: Seventy-one percent passed.
Mid-level Science Subtest 1: One-hundred percent passed. Mid-level Science Subtest 2: Ninety-two percent passed.
Pedagogy: Early Child 1: One-hundred percent passed. Pedagogy: Early Child 2: One-hundred percent passed.
Pedagogy: Elementary Subtest 1: Ninety percent passed. Pedagogy: Elementary Subtest 2: Ninety-two percent passed.
Pedagogy: Secondary Subtest 1: Ninety-three percent passed. Pedagogy: Secondary Subtest 2: Ninety-seven percent passed.
Physical Education Subtest 1: One-hundred percent passed. Physical Education Subtest 2: Ninety-three percent passed.
Physics Subtest 1: Sixty-seven percent passed. Physics Subtest 2: Twenty-five percent passed.
Reading Teacher Subtest 1: One-hundred percent passed. Reading Teacher Subtest 2: One-hundred percent passed.
Social Studies Subtest 1: Eighty-three percent passed. Social Studies Subtest 2: Seventy-five percent passed.
Spanish Subtest 1: Twenty-five percent passed. Spanish Subtest 2: One-hundred percent passed.
Special Education Core Skills Subtest 1: Sixty-six percent passed. Special Education Core Skills Subtest 2: Sixty-three percent passed.
Visual Arts Subtest 1: Ninety-three percent passed. Visual Arts Subtest 2: Seventy-six percent passed.
Vocal Classroom Music: One-hundred percent passed.
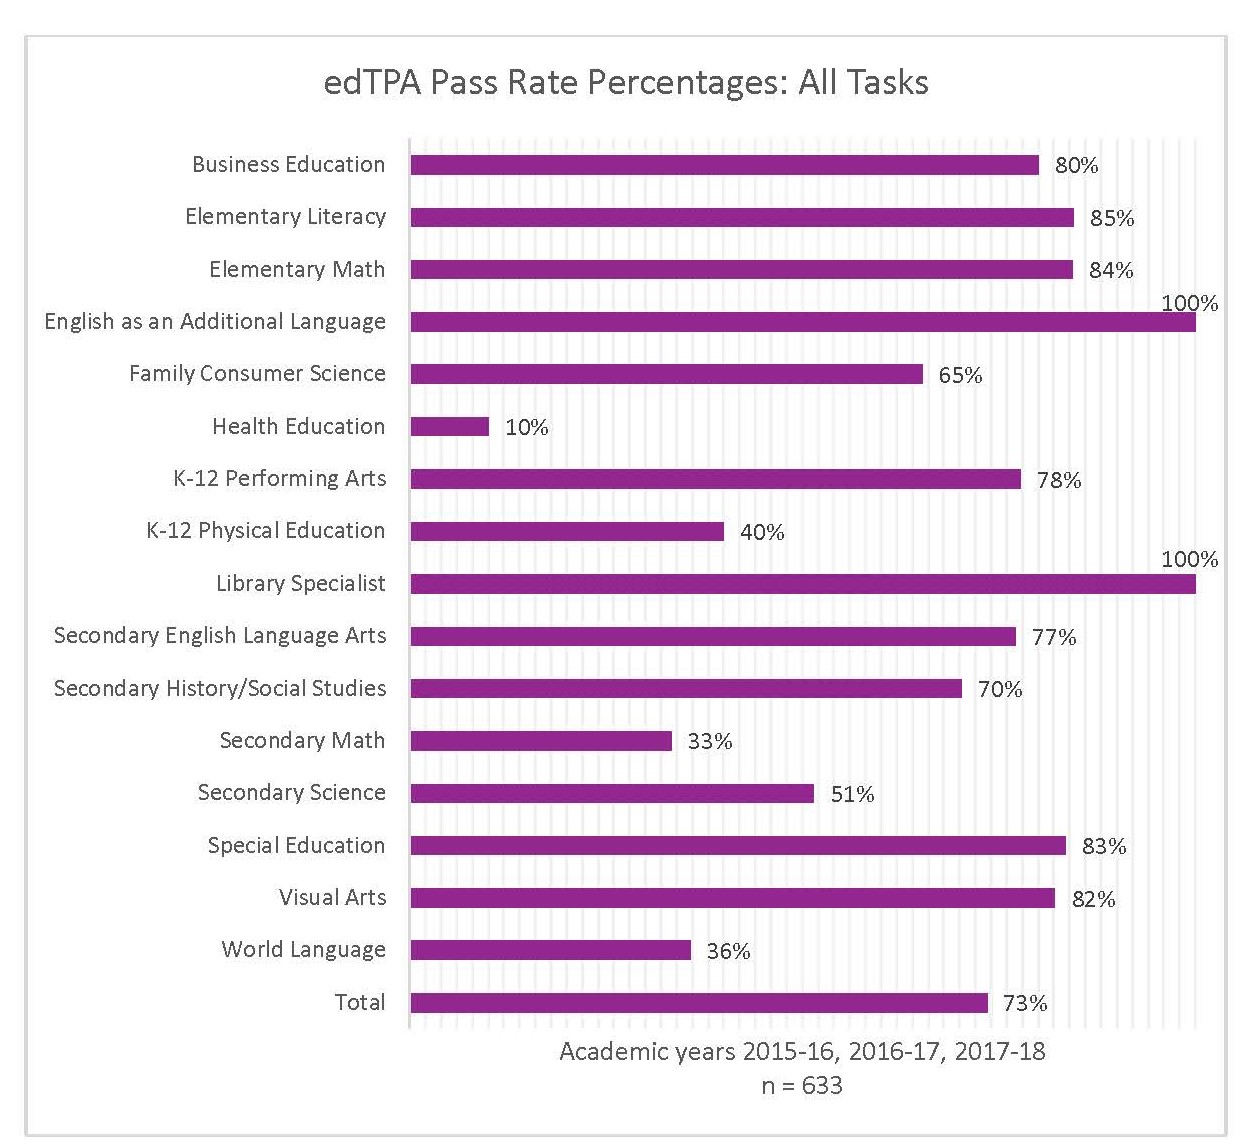
edTPA Pass Rate Percentages: All Tasks
The graph shows the overall pass rates for six-hundred and thirty-three teacher candidates over three academic years: 2015-16, 2016-17, and 2017-18. Across all sixteen edTPA areas, seventy-six percent passed all tasks on the first attempt. In addition to overall, the graph shows the percentage of candidates that passed all tasks on the first attempt by area: Business Education; eighty percent; Elementary Literacy, eighty-five percent; Elementary Math, eighty-four percent; English as an Additional Language, one-hundred percent; Family Consumer Science, sixty-five percent; Health Education, ten percent; kindergarten through twelve Performing Arts, seventy-eight percent; kindergarten through twelve Physical Education, forty percent; Library Specialist, one-hundred percent; Secondary English Language Arts, seventy-seven percent; Secondary History and Social Studies, seventy percent; Secondary Math, thirty-three percent; Secondary Science, fifty-one percent; Special Education, eighty-three percent; Visual Arts, eighty-two percent; World Languages, thirty-six percent)
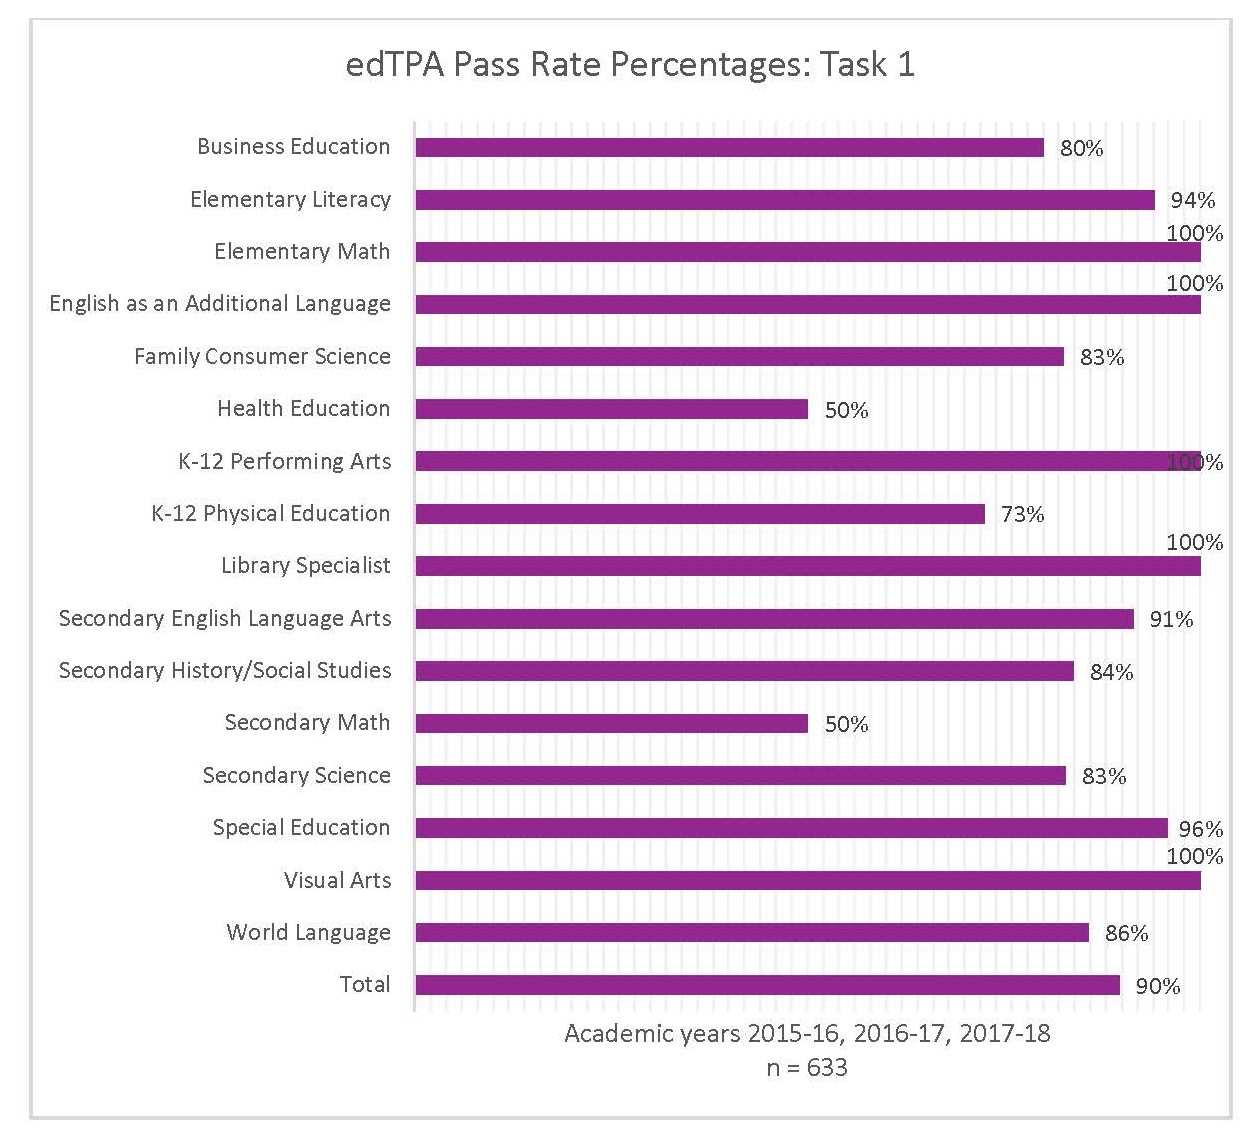
edTPA Pass Rate Percentages: Task 1
The graph shows the Task 1 pass rates for six-hundred and thirty-three teacher candidates over three academic years: 2015-16, 2016-17, and 2017-18. Across all sixteen areas, ninety percent passed Task 1 on the first attempt. In addition to overall, the graph shows the percentage of candidates that passed Task 1 on the first attempt by area: Business Education, eighty percent; Elementary Literacy, ninety-four percent; Elementary Math, one-hundred percent; English as an Additional Language, one-hundred percent; Family Consumer Science, eighty-three percent; Health Education, fifty percent; kindergarten through twelve Performing Arts, one-hundred percent; kindergarten through twelve Physical Education, seventy-three percent; Library Specialist, one-hundred percent; Secondary English Language Arts, ninety-one percent; Secondary History and Social Studies, eighty-four percent; Secondary Math, fifty percent; Secondary Science, eighty-three percent; Special Education, ninety-six percent; Visual Arts, one-hundred percent; World Languages, eighty-six percent
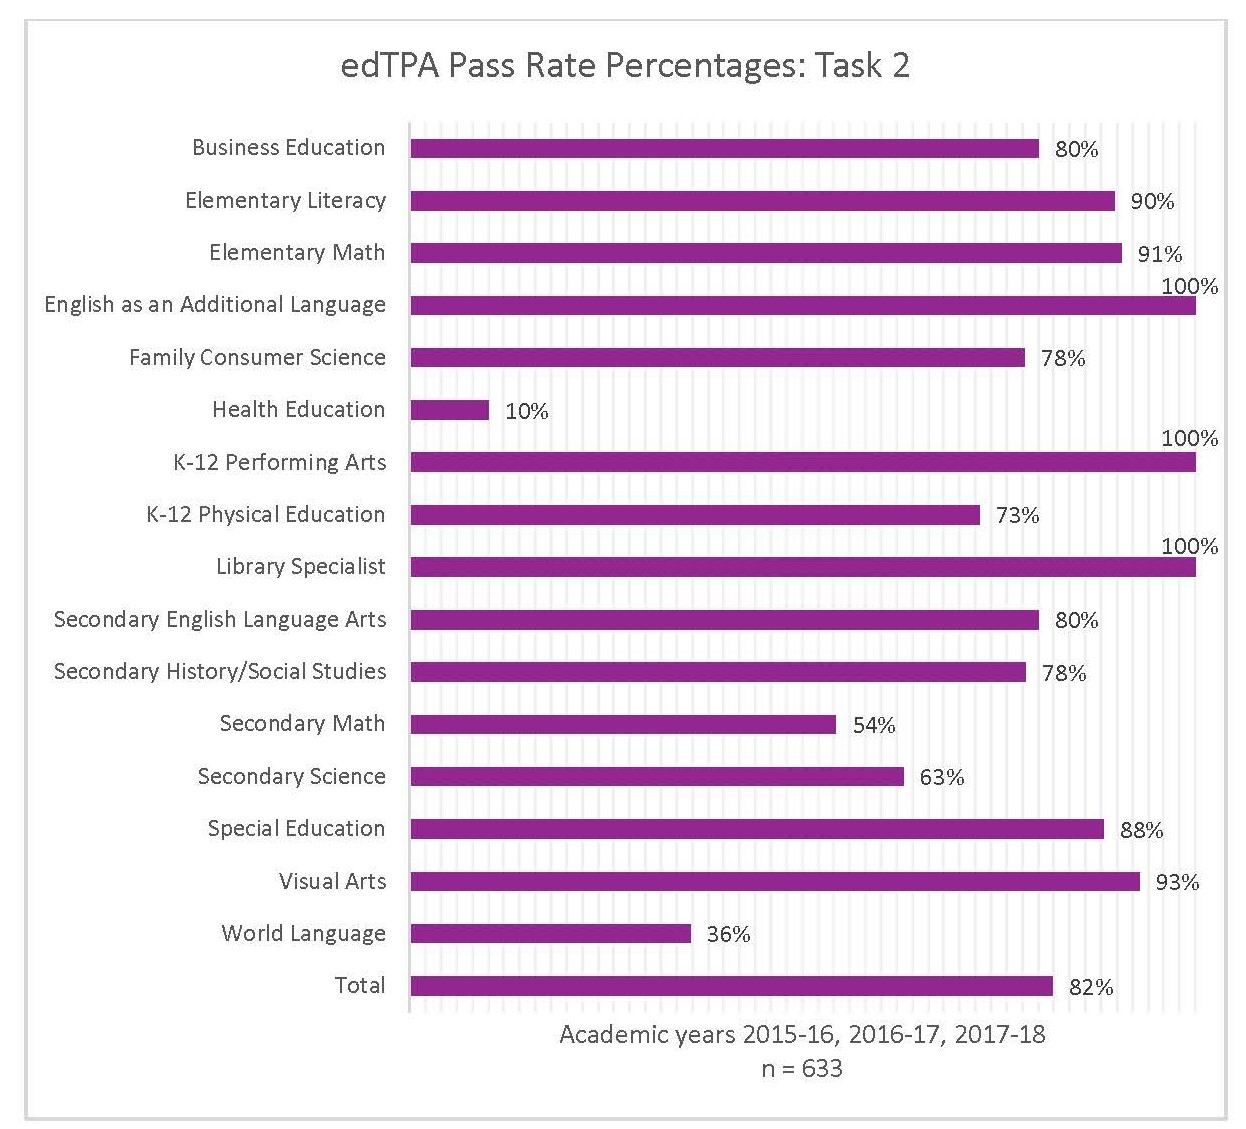
edTPA Pass Rate Percentages: Task 2
The graph shows the Task 2 pass rates for six-hundred and thirty-three teacher candidates over three academic years: 2015-16, 2016-17, and 2017-18. Across all sixteen areas, eighty-two percent passed Task 2 on the first attempt. In addition to overall, the graph shows the percentage of candidates that passed Task 2 on the first attempt by area: Business Education, eighty percent; Elementary Literacy, ninety percent; Elementary Math, ninety-one percent; English as an Additional Language, one-hundred percent; Family Consumer Science, seventy-eight percent; Health Education, ten percent; kindergarten through twelve Performing Arts, one-hundred percent; kindergarten through twelve Physical Education, seventy-three percent; Library Specialist, one-hundred percent; Secondary English Language Arts, eighty percent; Secondary History and Social Studies, seventy-eight percent; Secondary Math, 54 percent; Secondary Science, sixty-three percent; Special Education, 88 percent; Visual Arts, ninety-three percent; World Languages, thirty-six percent
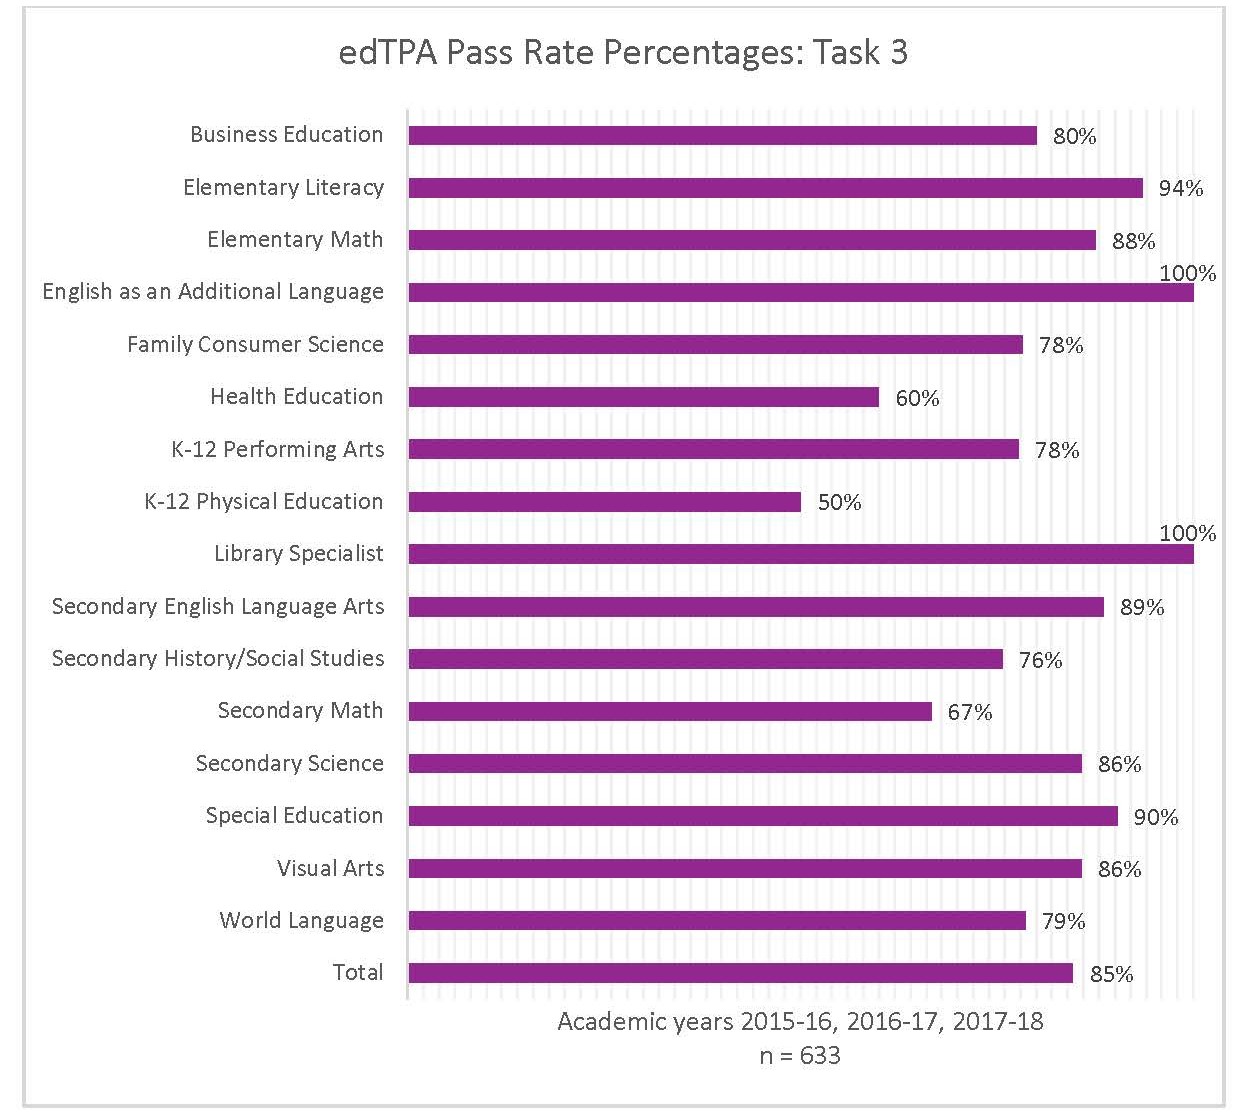
edTPA Pass Rate Percentages: Task 3
The graph shows the Task 3 pass rates for six-hundred and thirty-three teacher candidates over three academic years: 2015-16, 2016-17, and 2017-18. Across all sixteen areas, eighty-five percent passed Task 3 on the first attempt. In addition to overall, the graph shows the percentage of candidates that passed Task 3 on the first attempt by area: Business Education, eighty percent; Elementary Literacy, ninety-four percent; Elementary Math, eighty-eight percent; English as an Additional Language, one-hundred percent; Family Consumer Science, seventy-eight percent; Health Education, sixty percent; kindergarten through twelve Performing Arts, seventy-eight percent; kindergarten through twelve Physical Education, fifty percent; Library Specialist, one-hundred percent; Secondary English Language Arts, eighty-nine percent; Secondary History and Social Studies, seventy-six percent; Secondary Math, sixty-seven percent; Secondary Science, eighty-six percent; Special Education, ninety percent; Visual Arts, eighty-six percent; World Languages, seventy-nine percent
Ability to Be Hired
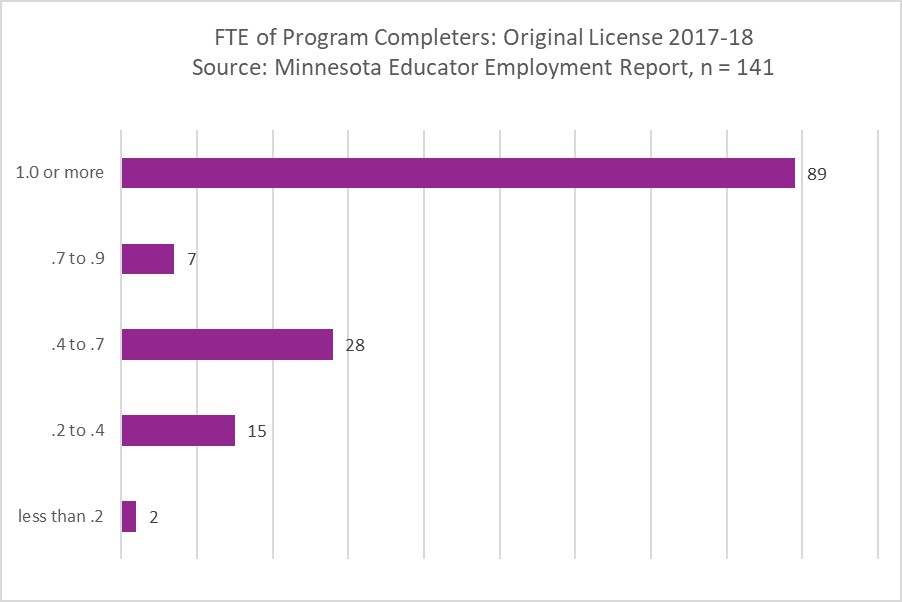
FTE of Program Completers
Source: Minnesota Educator Employment Report. The graph shows the full-time equivalent status of one-hundred and forty-one teachers who were newly licensed in 2017 and 2018. Eighty-nine teachers are working at or above full time. Seven teachers are working point seven to point nine. Twenty-eight teachers are working point 4 to point 7. Fifteen teachers are working point 2 to point 4, and two teachers are working ness than point 2.
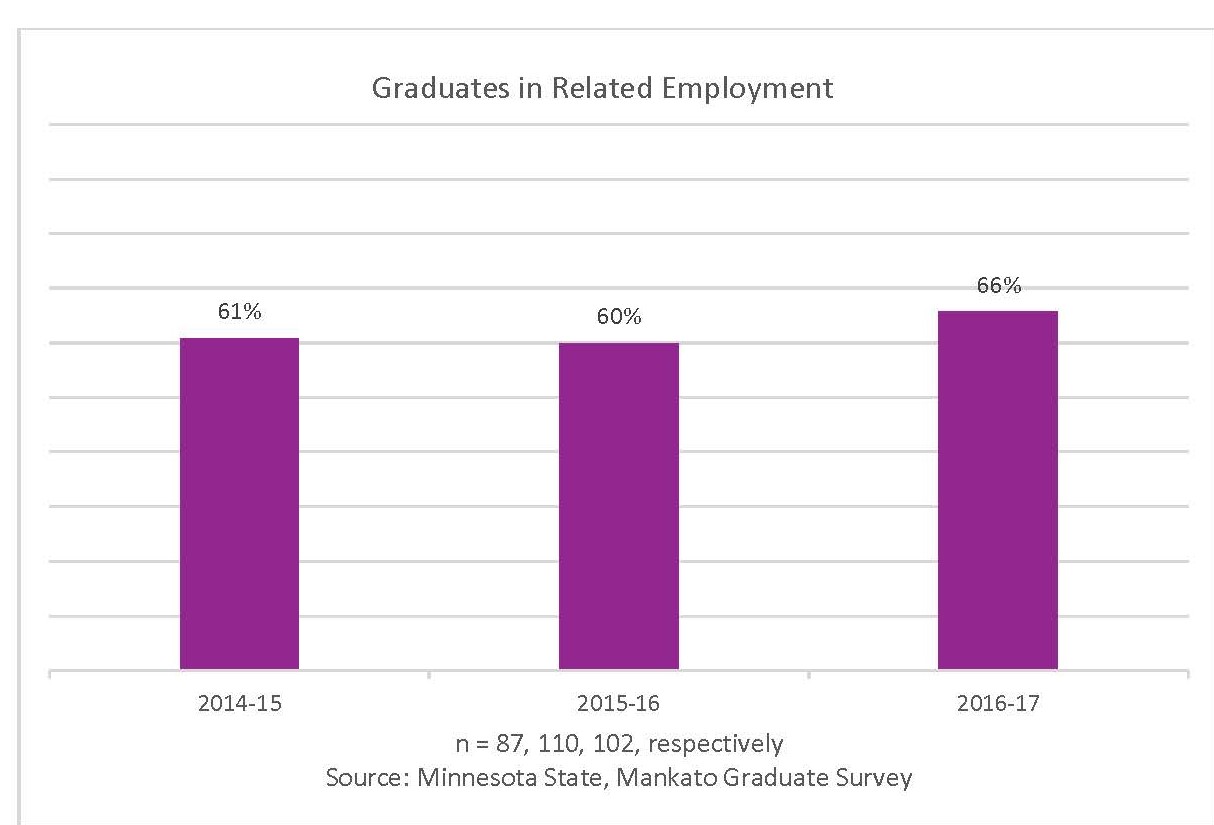
Graduates in Related Employment
Source: Minnesota State University, Graduate Survey. For three academic years, 2014-15, 2015-16, and 2016-17, sixty percent (n = eighty-seven), sixty-one percent (n = one-hundred and ten), and sixty-six percent (n = one-hundred and two) of graduates of education programs were employed in a field related to their degree.