2020 CAEP Annual Report
The College of Education reports annually to the Council for the Accreditation of Educator Preparation (CAEP) on performance in areas of public interest including teaching effectiveness, employer satisfaction and employment milestones, completer satisfaction, graduation rates, licensing outcomes, employment outcomes, and consumer information. The graphs and data below show performance in those areas.
Indicators of Teaching Effectiveness
Network for Excellence in Teaching Supervisor Survey 2018-2019
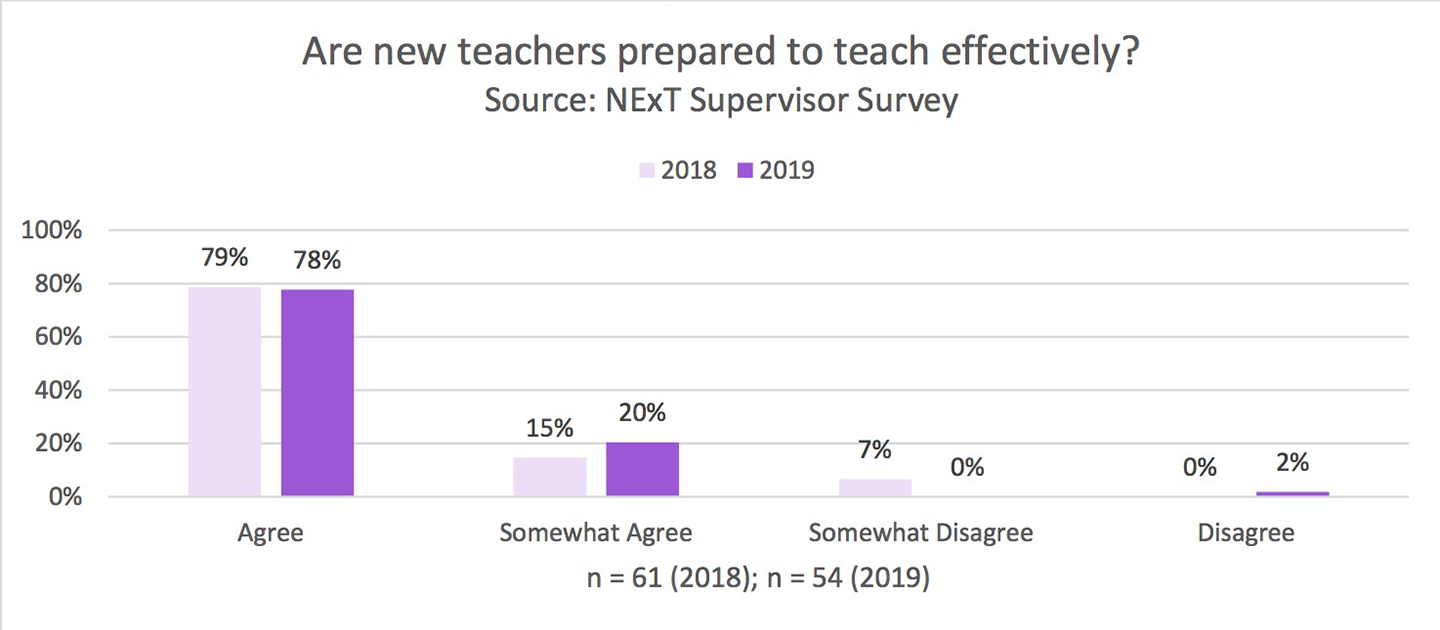
Are new teachers prepared to teach effectively? Source: NExT Supervisor Survey. In 2018, sixty-one supervisors responded. Seventy-nine percent agreed that new teachers are prepared to teach effectively, fifteen percent somewhat agreed, seven percent somewhat disagreed, zero percent disagreed. In 2019, fifty-four supervisors responded. Seventy-eight percent agreed that new teachers are prepared to teach effectively, twenty percent somewhat agreed, zero percent somewhat disagreed, and two percent disagreed.
Network for Excellence in Teaching Transition to Teaching Survey 2018-2019
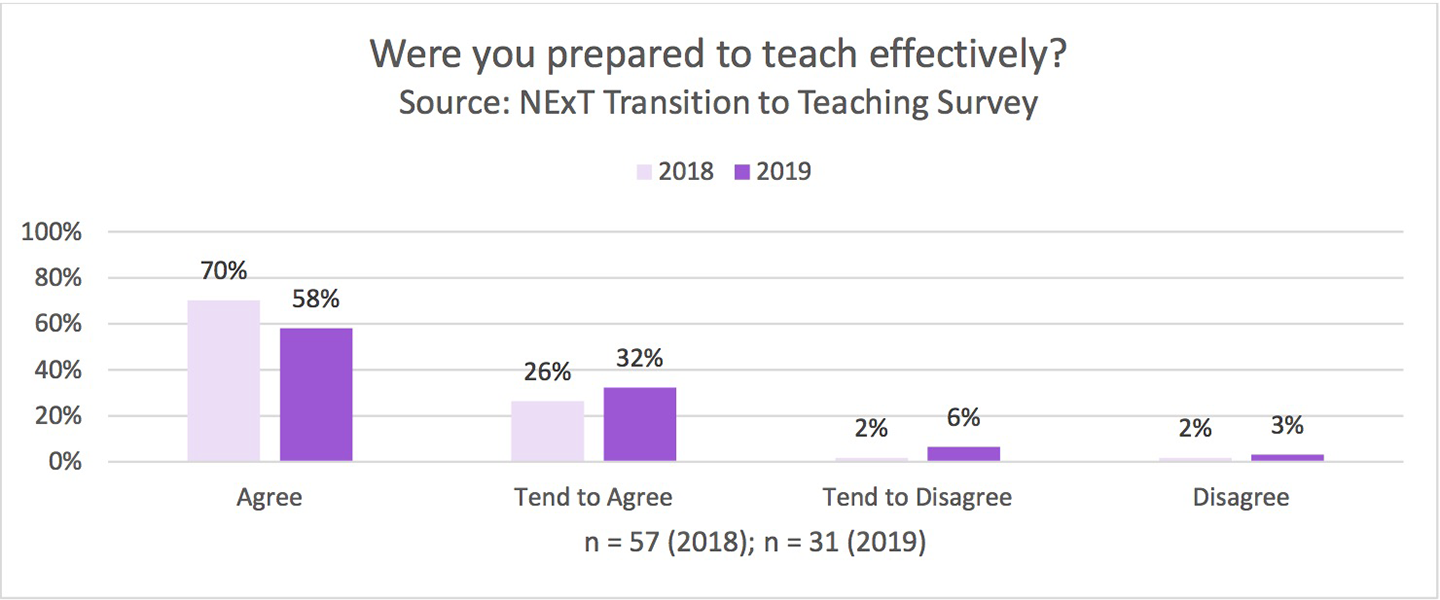
Were you prepared to teach effectively? Source: NExT Transition to Teaching Survey. In 2018, fifty-seven new teachers responded. Seventy percent agreed that they were prepared to teach effectively in their license area, twenty-six percent tended to agree, two percent tended to disagree, and two percent disagreed. In 2019, thirty-one new teachers responded. Fifty-eight percent of new teachers agreed that they are ready to teach effectively in their license area, thirty-two percent tended to agree, six percent tended to disagree, and three percent disagreed.
Network for Excellence in Teaching Exit Survey 2018-2019
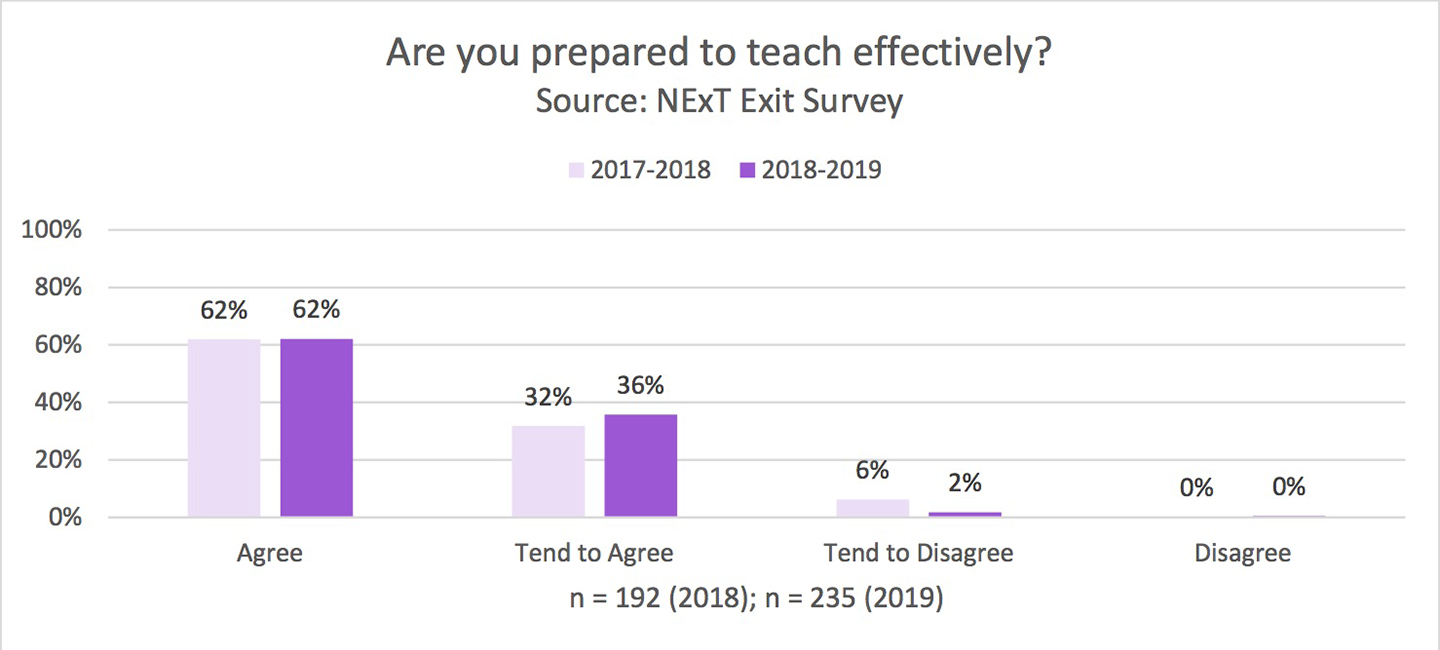
Are you prepared to teach effectively? Source: NExT Exit Survey. One hundred ninety-two student teachers responded for the 2017-2018 academic year. Sixty-two percent agreed that their program prepared them to teach effectively in their license area, thirty-two percent tended to agree, six percent tended to disagree, and zero percent disagreed. Two hundred thirty-five student teachers responded for the 2018-2019 academic year. Sixty-two percent agreed that their program prepared them to teach effectively in their license area, thirty-six percent tended to agree, two percent tended to disagree, and zero percent disagreed.
Employer Satisfaction and Employment Milestones
Network for Excellence in Teaching Supervisor Survey 2018-2019
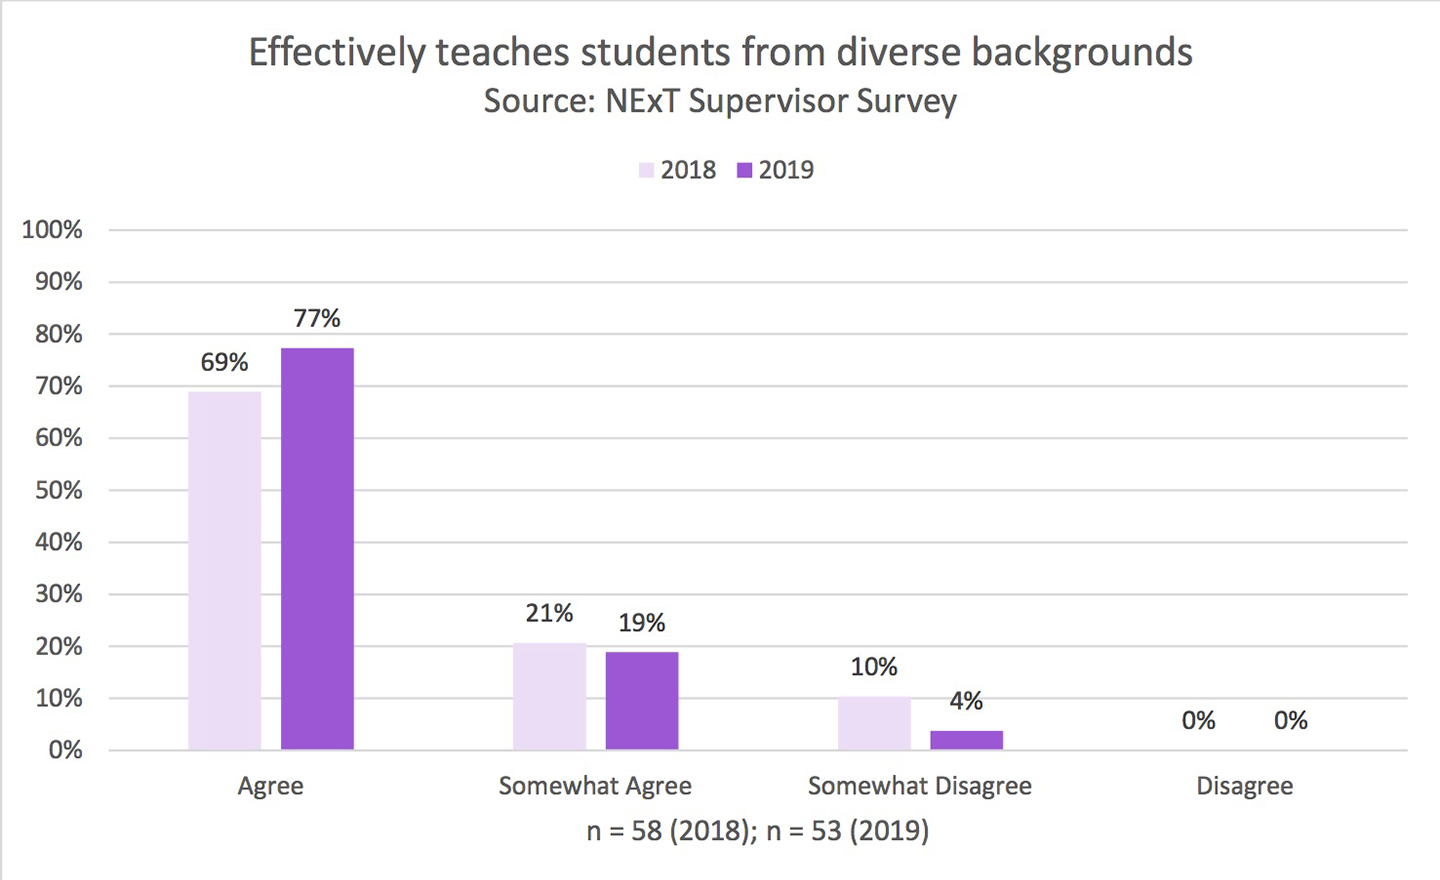
Effectively teaches students from diverse backgrounds. Source: NExT Supervisor Survey. In 2018, fifty-eight supervisors responded. Sixty-nine percent agreed that new teachers effectively teach students from diverse backgrounds, twenty-one percent somewhat agreed, ten percent somewhat disagreed, and zero percent disagreed. In 2019, fifty-three supervisors responded. Seventy-seven percent agreed, nineteen percent somewhat agreed, four percent somewhat disagreed, and zero percent disagreed.
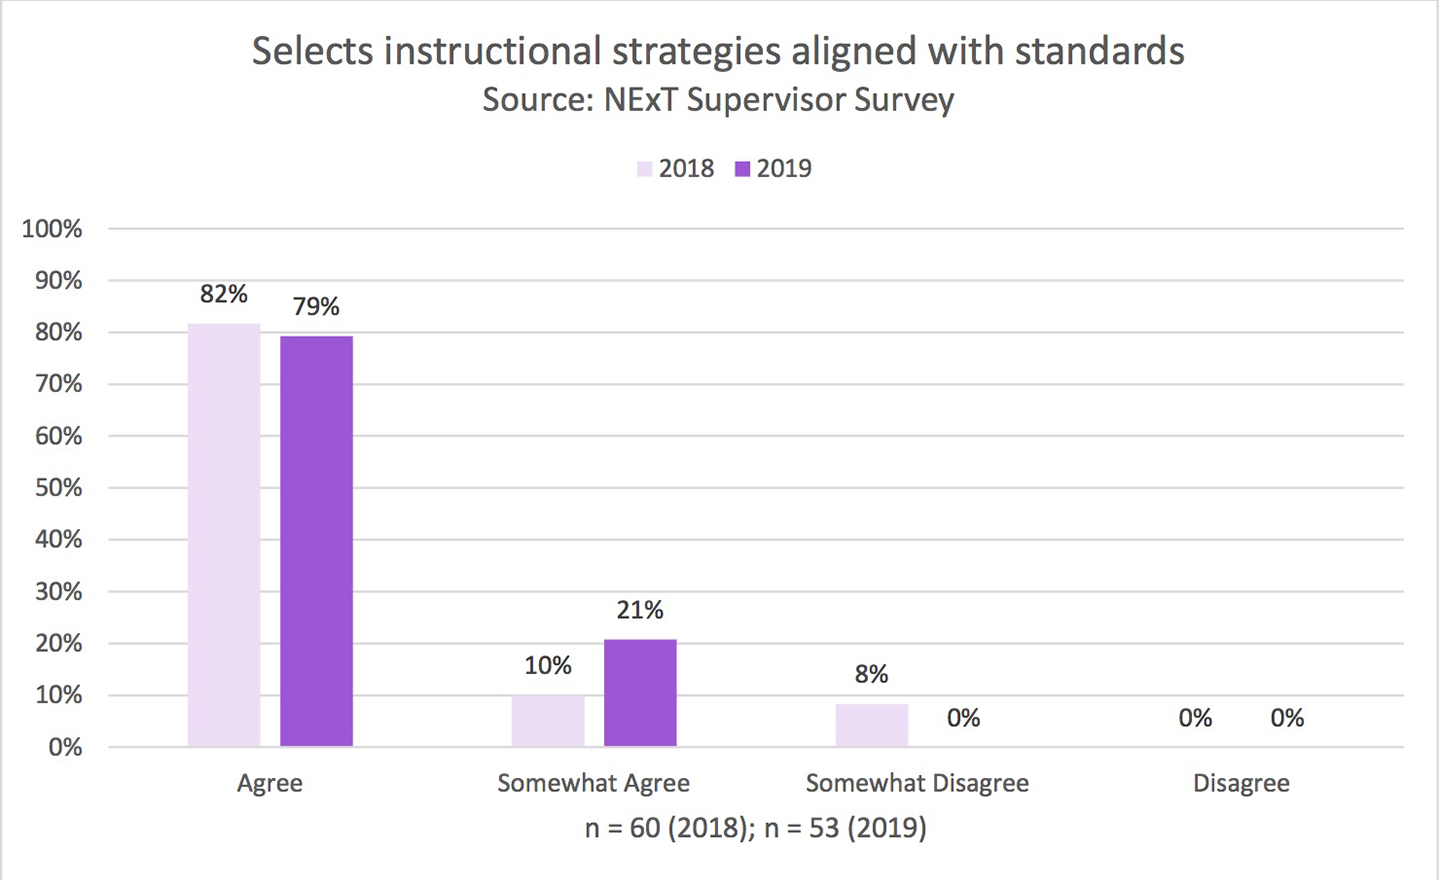
Network for Excellence in Teaching Supervisor Survey 2018-2019
Selects instructional strategies aligned with standards. Source: NExT Supervisor Survey. In 2018, sixty supervisors responded. Eighty-two percent agreed that new teachers select instructional strategies aligned with standards, ten percent somewhat agreed, eight percent somewhat disagreed, and zero percent disagreed. In 2019, fifty-three supervisors responded. Seventy-nine percent agreed, twenty-one percent tended to agree, zero percent somewhat disagreed, and zero percent disagreed.
Network for Excellence in Teaching Supervisor Survey 2018-2019
Collaborates with families to support learning. Source: NExT Supervisor Survey. In 2018, sixty-one supervisors responded. Seventy-nine percent agreed that new teachers collaborate with families to support learning, eighteen percent somewhat agreed, two percent somewhat disagreed, and two percent disagreed. In 2019, fifty-one supervisors responded. Sixty-seven percent agreed, thirty-one percent somewhat agreed, zero percent somewhat disagreed, and two percent disagreed.
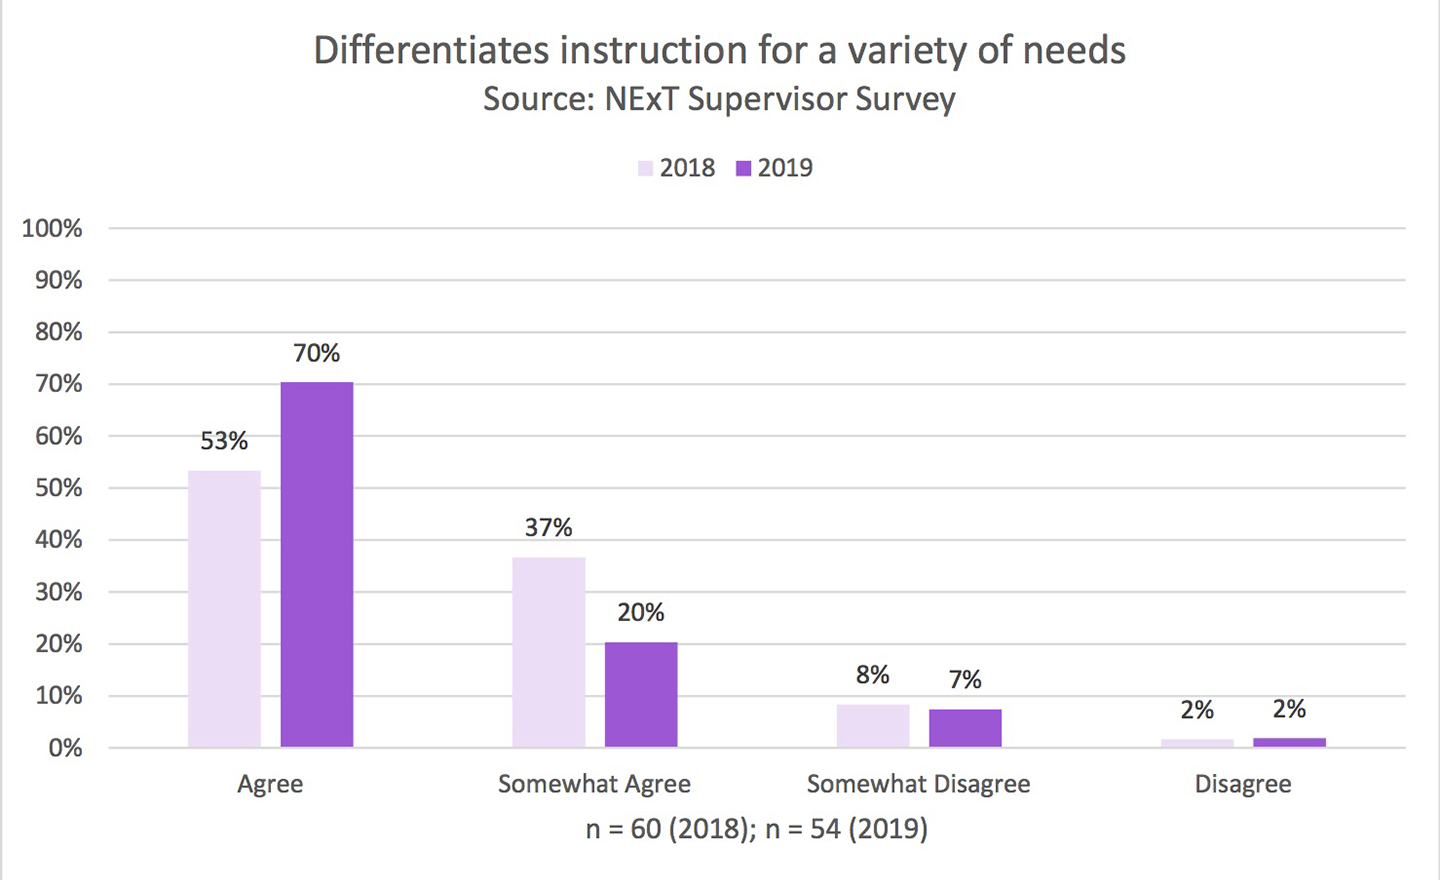
Network for Excellence in Teaching Supervisor Survey 2018-2019
Differentiates instruction for a variety of needs. Source: NExT Supervisor Survey. In 2018, sixty supervisors responded. Fifty-three percent agreed that new teachers differentiate instruction for a variety of needs, thirty-seven percent somewhat agreed, eight percent somewhat disagreed, and two percent disagreed. In 2019, fifty-four supervisors responded. Seventy percent agreed, twenty percent somewhat agreed, seven percent somewhat disagreed, and two percent disagreed.
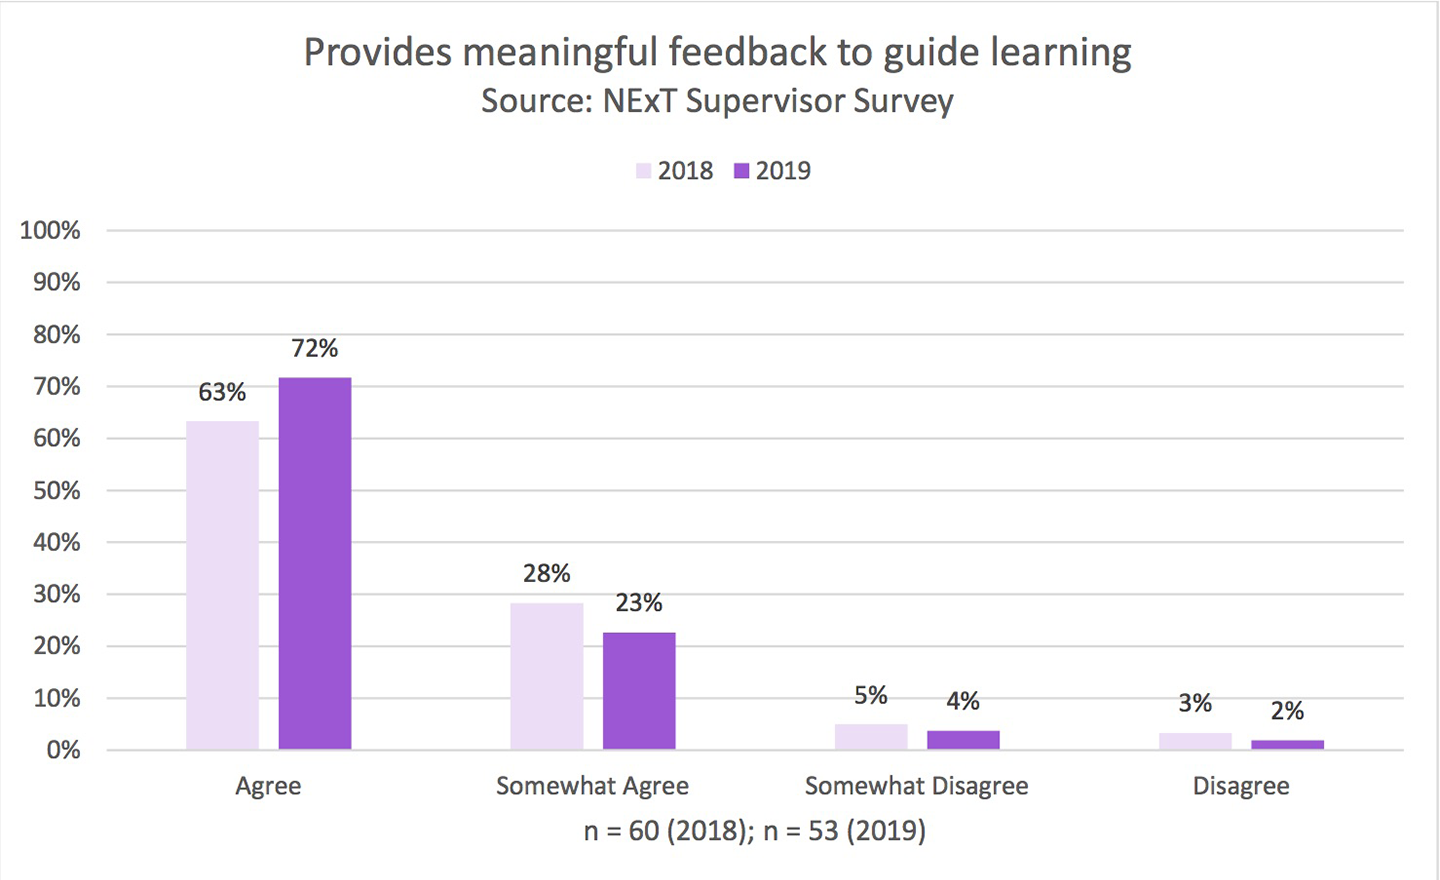
Network for Excellence in Teaching Supervisor Survey 2018-2019
Provides meaningful feedback to guide learning. Source: NExT Supervisor Survey. In 2018, sixty supervisors responded. Sixty-three percent agreed that new teachers provide meaningful feedback to guide learning, twenty-eight percent somewhat agreed, five percent somewhat disagreed, and three percent disagreed. In 2019, fifty-three supervisors responded. Seventy-two percent agreed, twenty-three percent somewhat agreed, four percent somewhat disagreed, and two percent disagreed.

Network for Excellence in Teaching Supervisor Survey 2018-2019
Creates an environment in which differences are respected. Source: NExT Supervisor Survey. In 2018, fifty-nine supervisors responded. Seventy-eight percent agreed that new teachers create an environment in which differences are respected, nineteen percent somewhat agreed, two percent somewhat disagreed, and two percent disagreed. In 2019, fifty-four supervisors responded. Seventy-eight percent agreed, twenty-two percent somewhat agreed, zero percent somewhat disagreed, and zero percent disagreed.
Completer Satisfaction
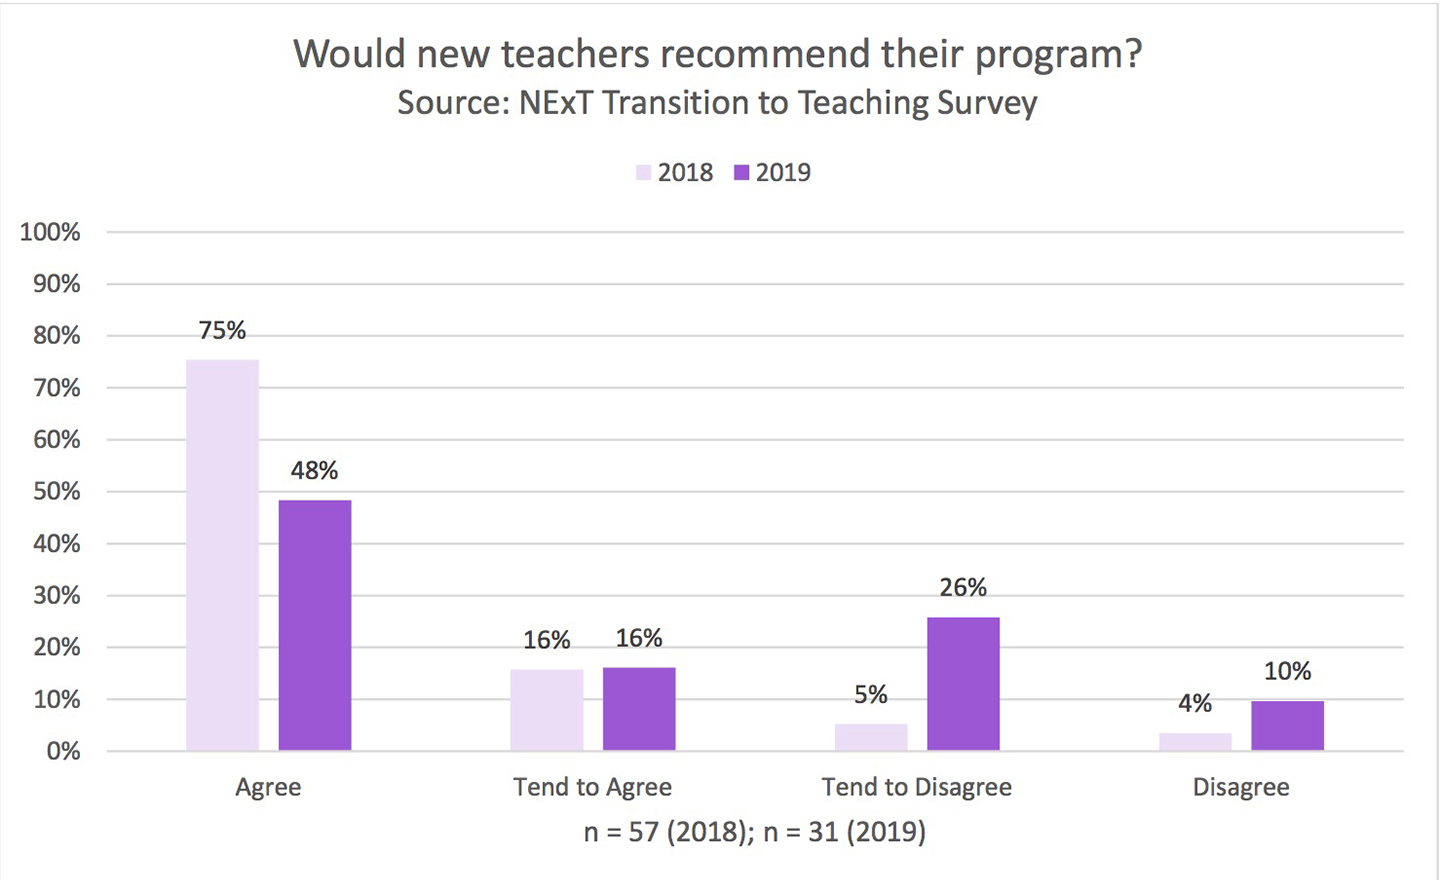
Network for Excellence in Teaching Transition to Teaching Survey 2018-2019
Would new teachers recommend their program? Source: NExT Transition to Teaching Survey. In 2018, fifty-seven new teachers responded. Seventy-five percent agreed that they would recommend their program, sixteen percent tended to agree, five percent tended to disagree, and four percent disagreed. In 2019, thirty-one new teachers responded. Forty-eight percent agreed, sixteen percent tended to agree, twenty-six percent tended to disagree, and ten percent disagreed.
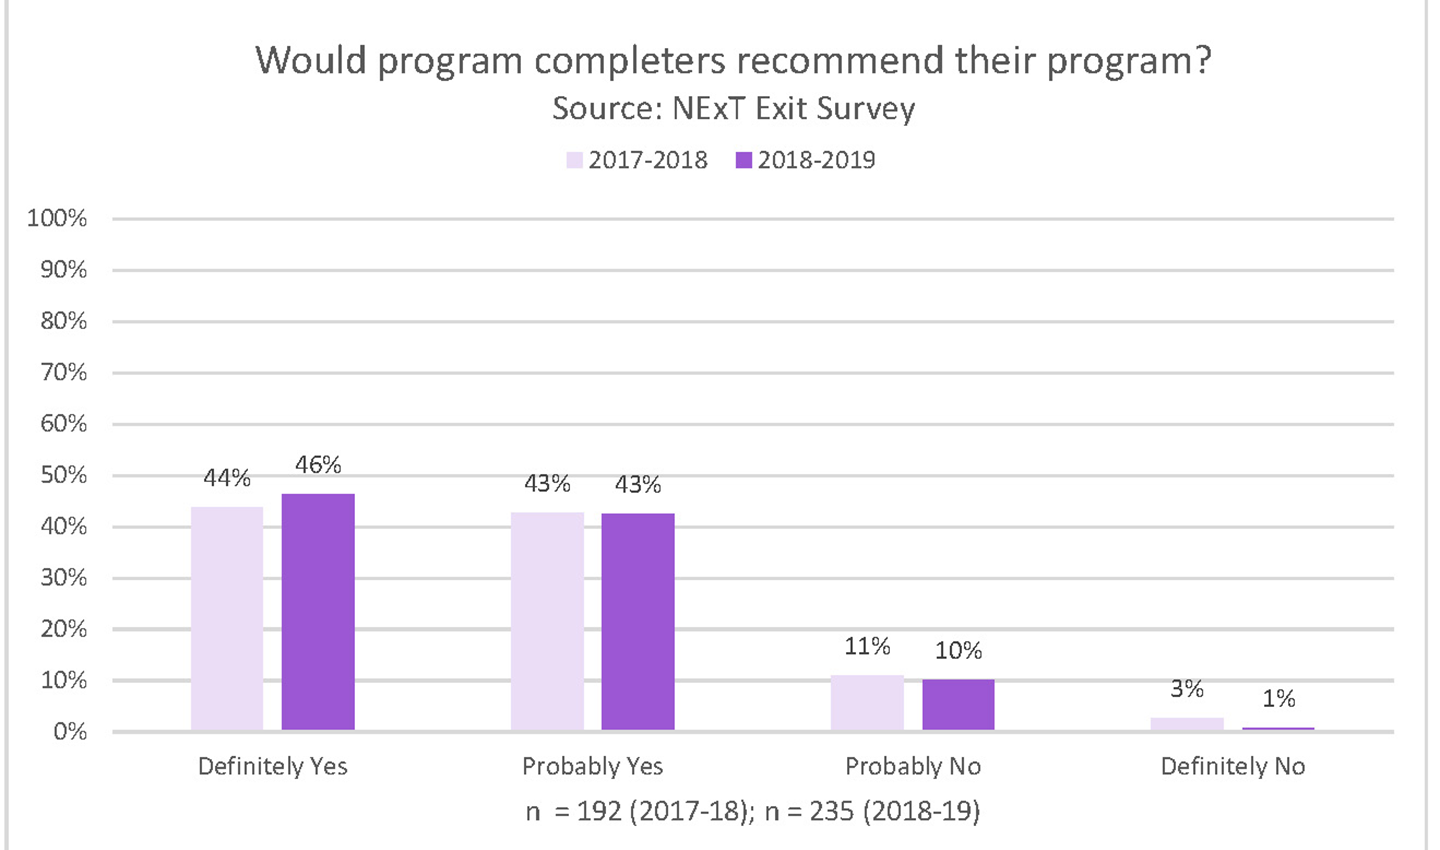
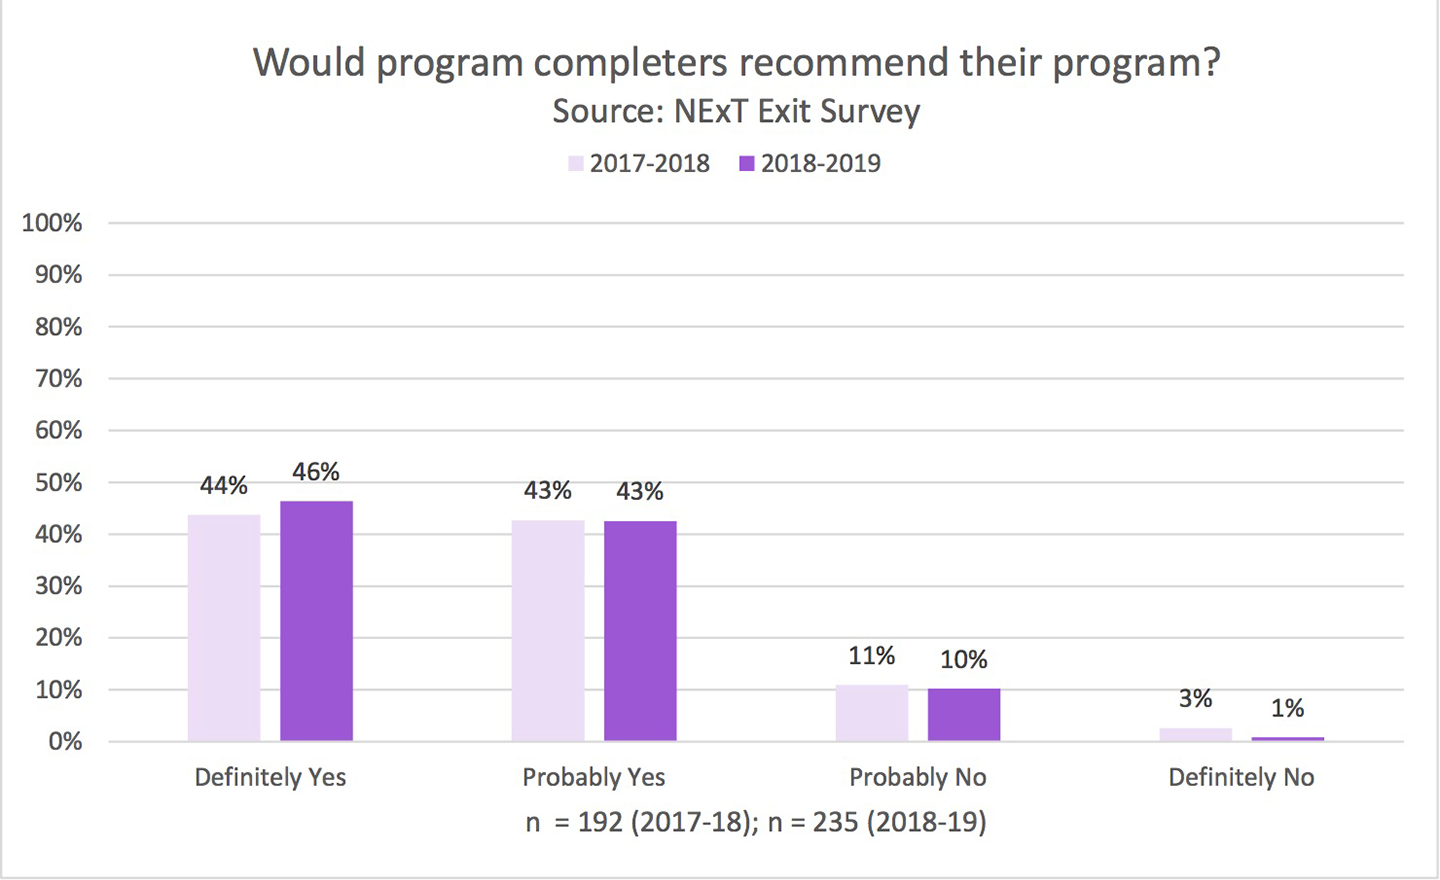
Network for Excellence in Teaching Exit Survey 2018-2019
Would program completers recommend their program? Source: NExT Exit Survey. One hundred ninety-two student teachers responded for the 2017-2018 academic year. Forty-four percent agreed they would recommend their program, forty-three percent somewhat agreed, eleven percent somewhat disagreed, and three percent disagreed. Two hundred thirty-five student teachers responded for the 2018-2019 academic year. Forty-six percent agreed, forty-three percent somewhat agreed, ten percent somewhat disagreed, and one percent disagreed.
Graduation Rates
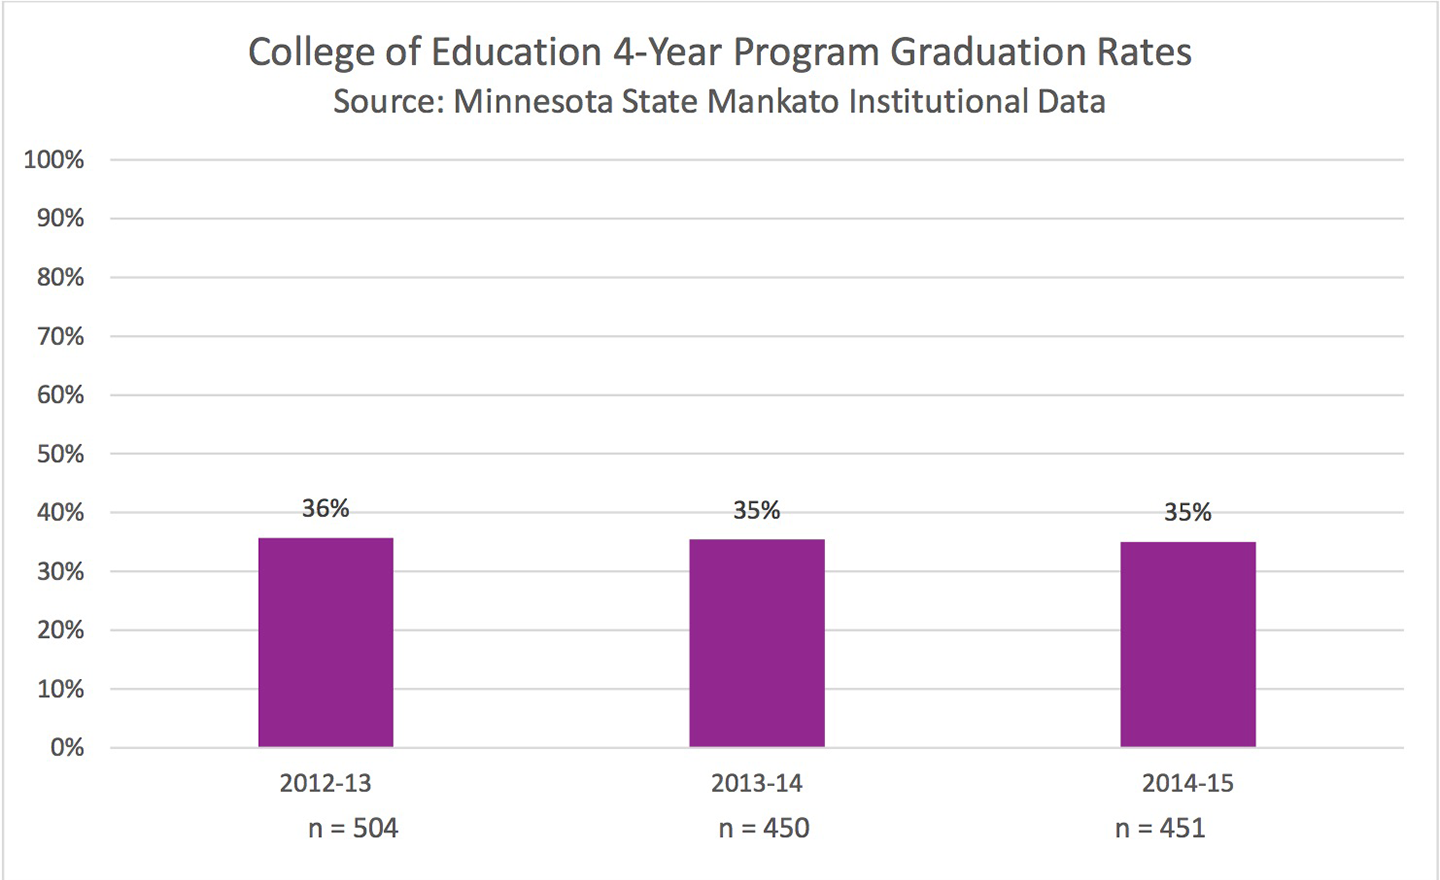
Minnesota State Mankato Institutional Data
College of Education 4-Year Program Graduation Rates. Source: Minnesota State Mankato Institutional Data. Graduation rates after four years for three entering terms. Fall 2012: thirty-six percent, n = 504. Fall 2013: thirty-five percent, n = 450. Fall 2014: thirty-five percent, n = 451.
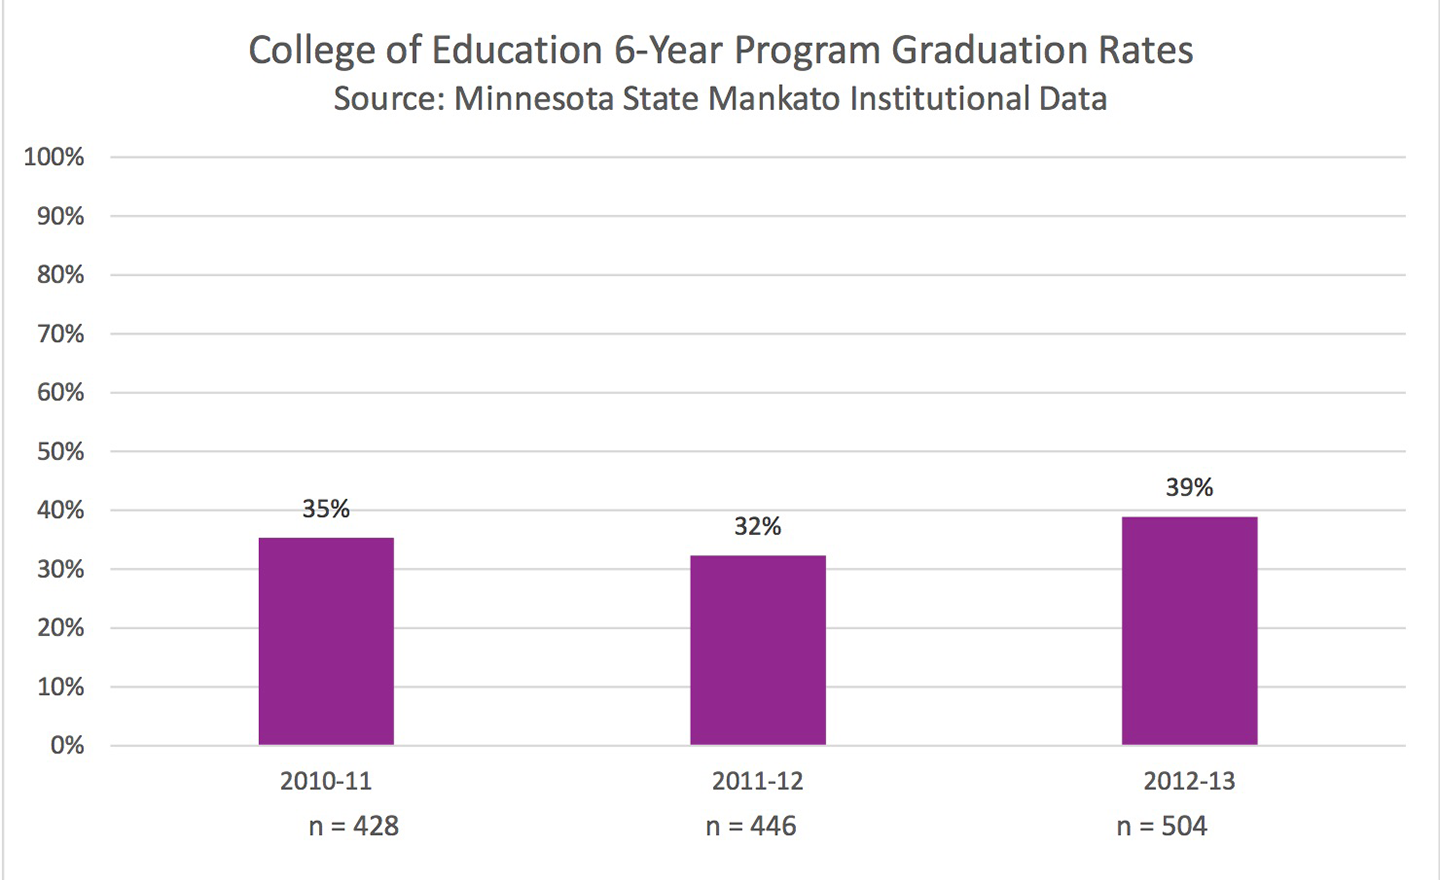
Minnesota State Mankato Institutional Data
College of Education 6-Year Program Graduation Rates. Source: Minnesota State Mankato Institutional Data. Graduation rates after six years for entering terms. Fall 2010: thirty-five percent, n = 428. Fall 2011: thirty-two percent, n = 446. Fall 2012: thirty-nine percent, n = 504.
Ability to Meet Licensing Requirements
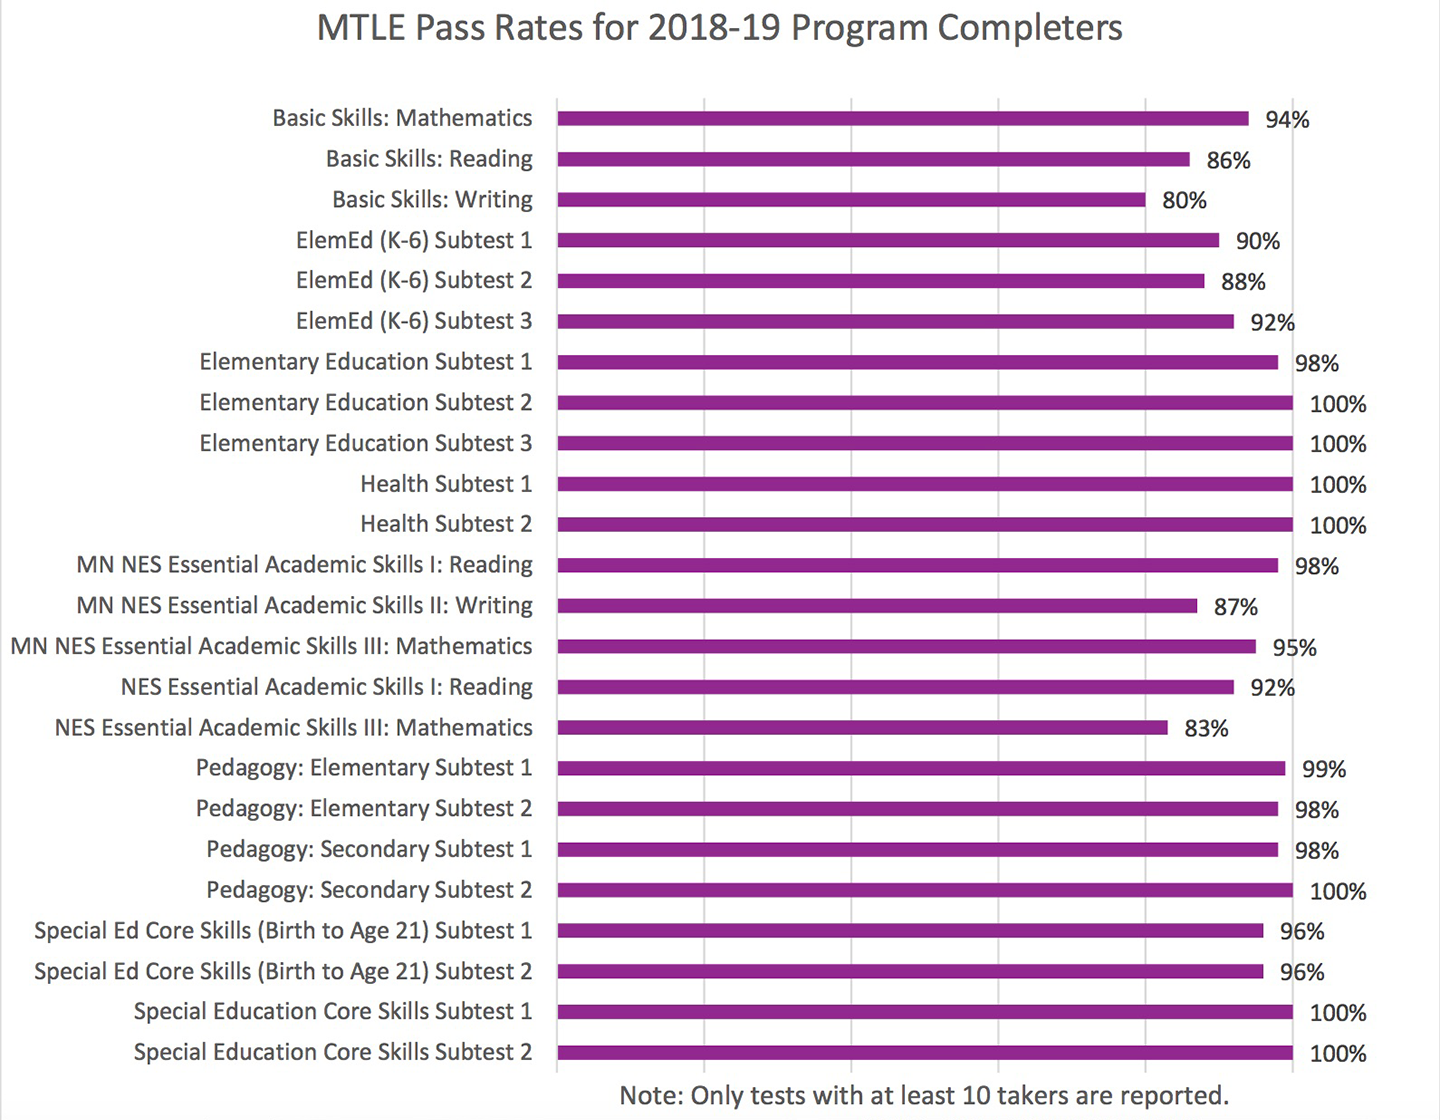
State Assessment Pass Rates
Minnesota Teacher Licensure Exam (MTLE) Pass Rates for 2018-19 Program Completers. Basic Skills Mathematics: Ninety-four percent passed. Basic Skills Reading: Eighty-six percent passed. Basic Skills Writing: Eighty percent passed. Elementary Education (k-6) subtest one: Ninety percent passed. Elementary Education (k-6) subtest two: Eighty-six percent passed. Elementary Education (k-6) subtest three: Ninety-two percent passed. Elementary Education subtest one: Ninety-eight percent passed. Elementary Education subtest two: One hundred percent passed. Elementary Education subtest three: One hundred percent passed. Health Subtest one: One hundred percent passed. Health Subtest two: One hundred percent passed. Minnesota NES Essential Academic Skills one: Reading: Ninety-eight percent passed. Minnesota NES Essential Academic Skills two: Writing: Eighty-seven percent passed. Minnesota NES Essential Academic Skills three: Mathematics: Ninety-five percent passed. NES Essential Academic Skills one: Reading: Ninety-two percent passed. NES Essential Academic Skills three: Mathematics: Eighty-three percent passed. Pedagogy: Elementary Subtest one: Ninety-nine percent passed. Pedagogy: Elementary Subtest two: Ninety-eight percent passed. Pedagogy: Secondary Subtest one: Ninety-eight percent passed. Pedagogy: Secondary Subtest two: One hundred percent passed. Special Education Core Skills (Birth to Age 21) Subtest one: Ninety-six percent passed. Special Education Core Skills (Birth to Age 21) Subtest two: Ninety-six percent passed. Special Education Core Skills Subtest one: One hundred percent passed. Special Education Core Skills Subtest two: One hundred percent passed.
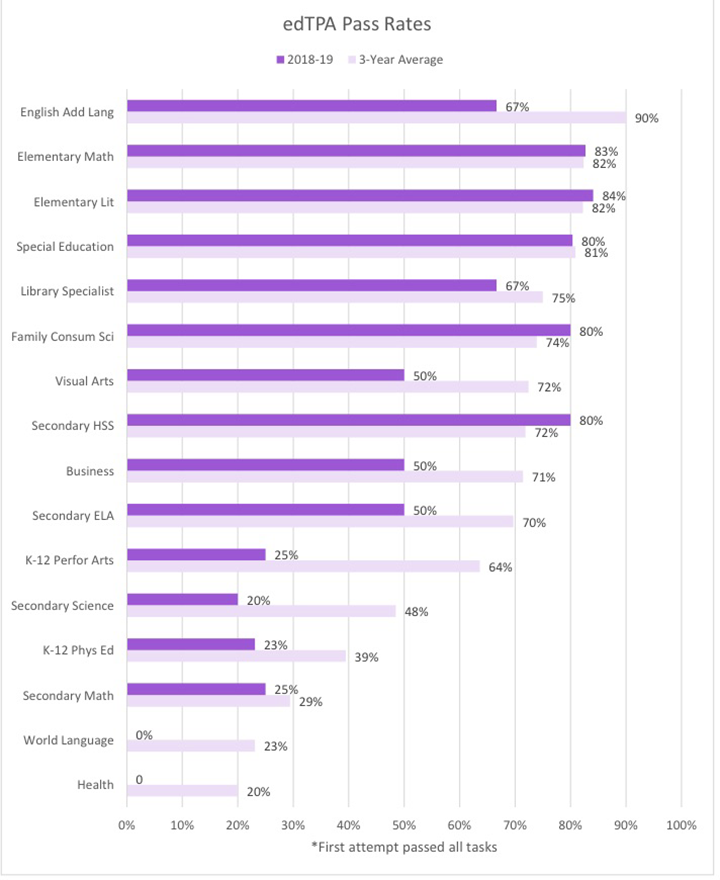
edTPA Pass Rate Percentages: All Tasks
edTPA pass rates. The graph shows pass rates for all three edTPA tasks for the 2018-2019 academic year compared with three-year average pass rates by area: English as an Additional Language: sixty-seven percent and ninety percent. Elementary Mathematics: eighty-three percent and eighty-two percent. Elementary Literacy: eighty-four percent and eighty-two percent. Special Education: eighty percent and eighty-one percent. Library Specialist: sixty-seven percent and seventy-five percent. Family Consumer Science: eighty percent and seventy-four percent. Visual Arts: fifty percent and seventy-two percent. Secondary History and Social Studies: eighty percent and seventy-two percent. Business: fifty percent and seventy-one percent. Secondary English Language Arts: fifty percent and seventy percent. K-12 Performing Arts: twenty-five percent and sixty-four percent. Secondary Science: twenty percent and forty-eight percent. K-12 Physical Education: twenty-three percent and thirty-nine percent. Secondary Math: twenty-five percent and twenty-nine percent. World Languages: zero percent and twenty-three percent. Health: zero percent and twenty percent.
Ability to Be Hired
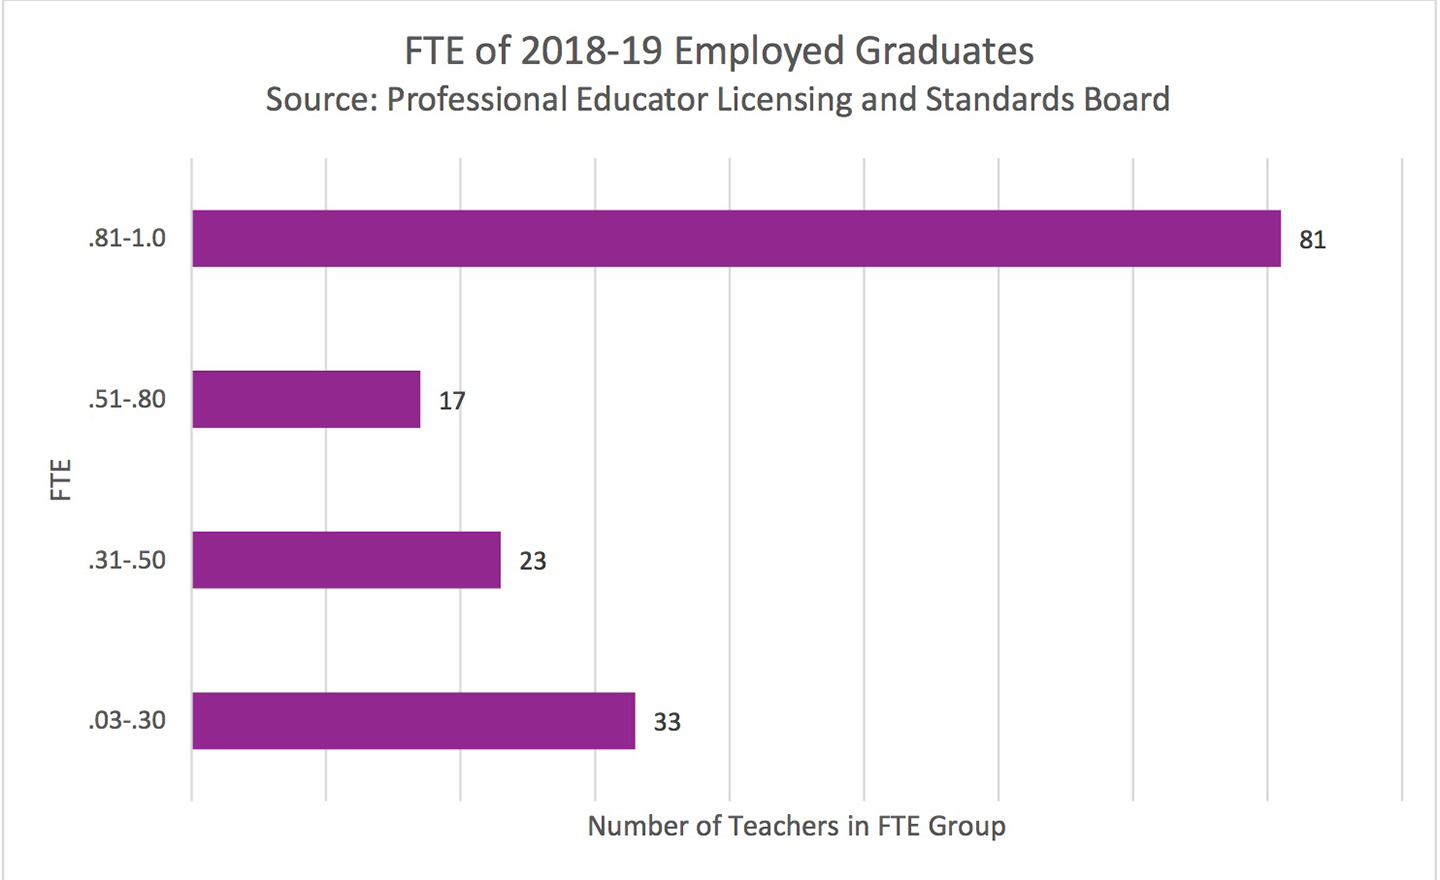
FTE of Program Completers
FTE of 2018-19 Employed Graduates. Source: Minnesota Educator Employment Report. The graph shows the full-time equivalent status of teachers who were newly licensed in 2018 and 2019. Eighty-one teachers are working at .81 to 1.0. Seventeen teachers are working .51 to .8. Twenty-three teachers are working .31 to .5. Thirty-three teachers are working .03 to .3.
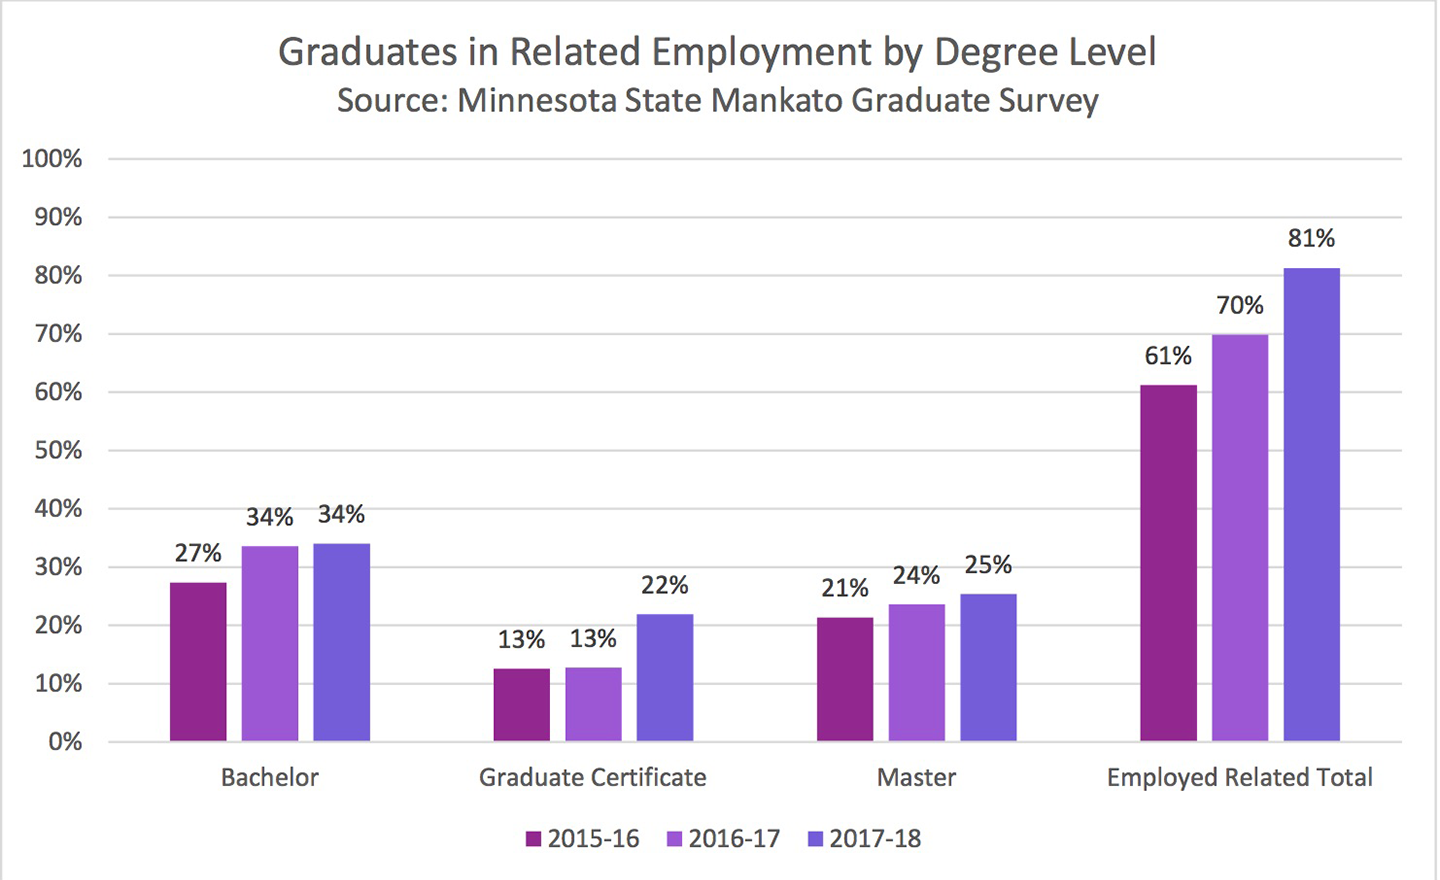
Graduates in Related Employment
College of Education Graduates in Related Employment. Source: Minnesota State University, Graduate Survey. For the 2015-16 academic year, fifty-six percent of graduates with a bachelor's degree are working in related employment, fifty-nine percent of graduates with a graduate certificate are working in related employment, and seventy percent of graduates with a master's degree are working in related employment. For the 2016-17 academic year, sixty-six percent of graduates with a bachelor's are working in related employment, seventy-two percent of graduates with a graduate certificate are working in related employment, and seventy five percent of graduates with a master's degree are working in related employment. For the 2017-18 academic year, eighty-two percent of graduates with a bachelor's degree are working in related employment, seventy-eight percent of graduates with a graduate certificate are working in related employment, and eighty-four percent of students with a master's degree are working in related employment.