2025 CAEP Accountability Measures
The College of Education reports annually to the Council for the Accreditation of Educator Preparation (CAEP) on performance in areas of public interest including completer effectiveness, employer satisfaction, competency at program completion, and employment outcomes. The information on this page was created from data collected or reported during the 2023-2024 academic year.
Measure 1: Completer Effectiveness (R4.1)
In lieu of value-added data, which Minnesota does not distribute, the college has employed case study methods to evaluate the impact of completers on P-12 learner development.
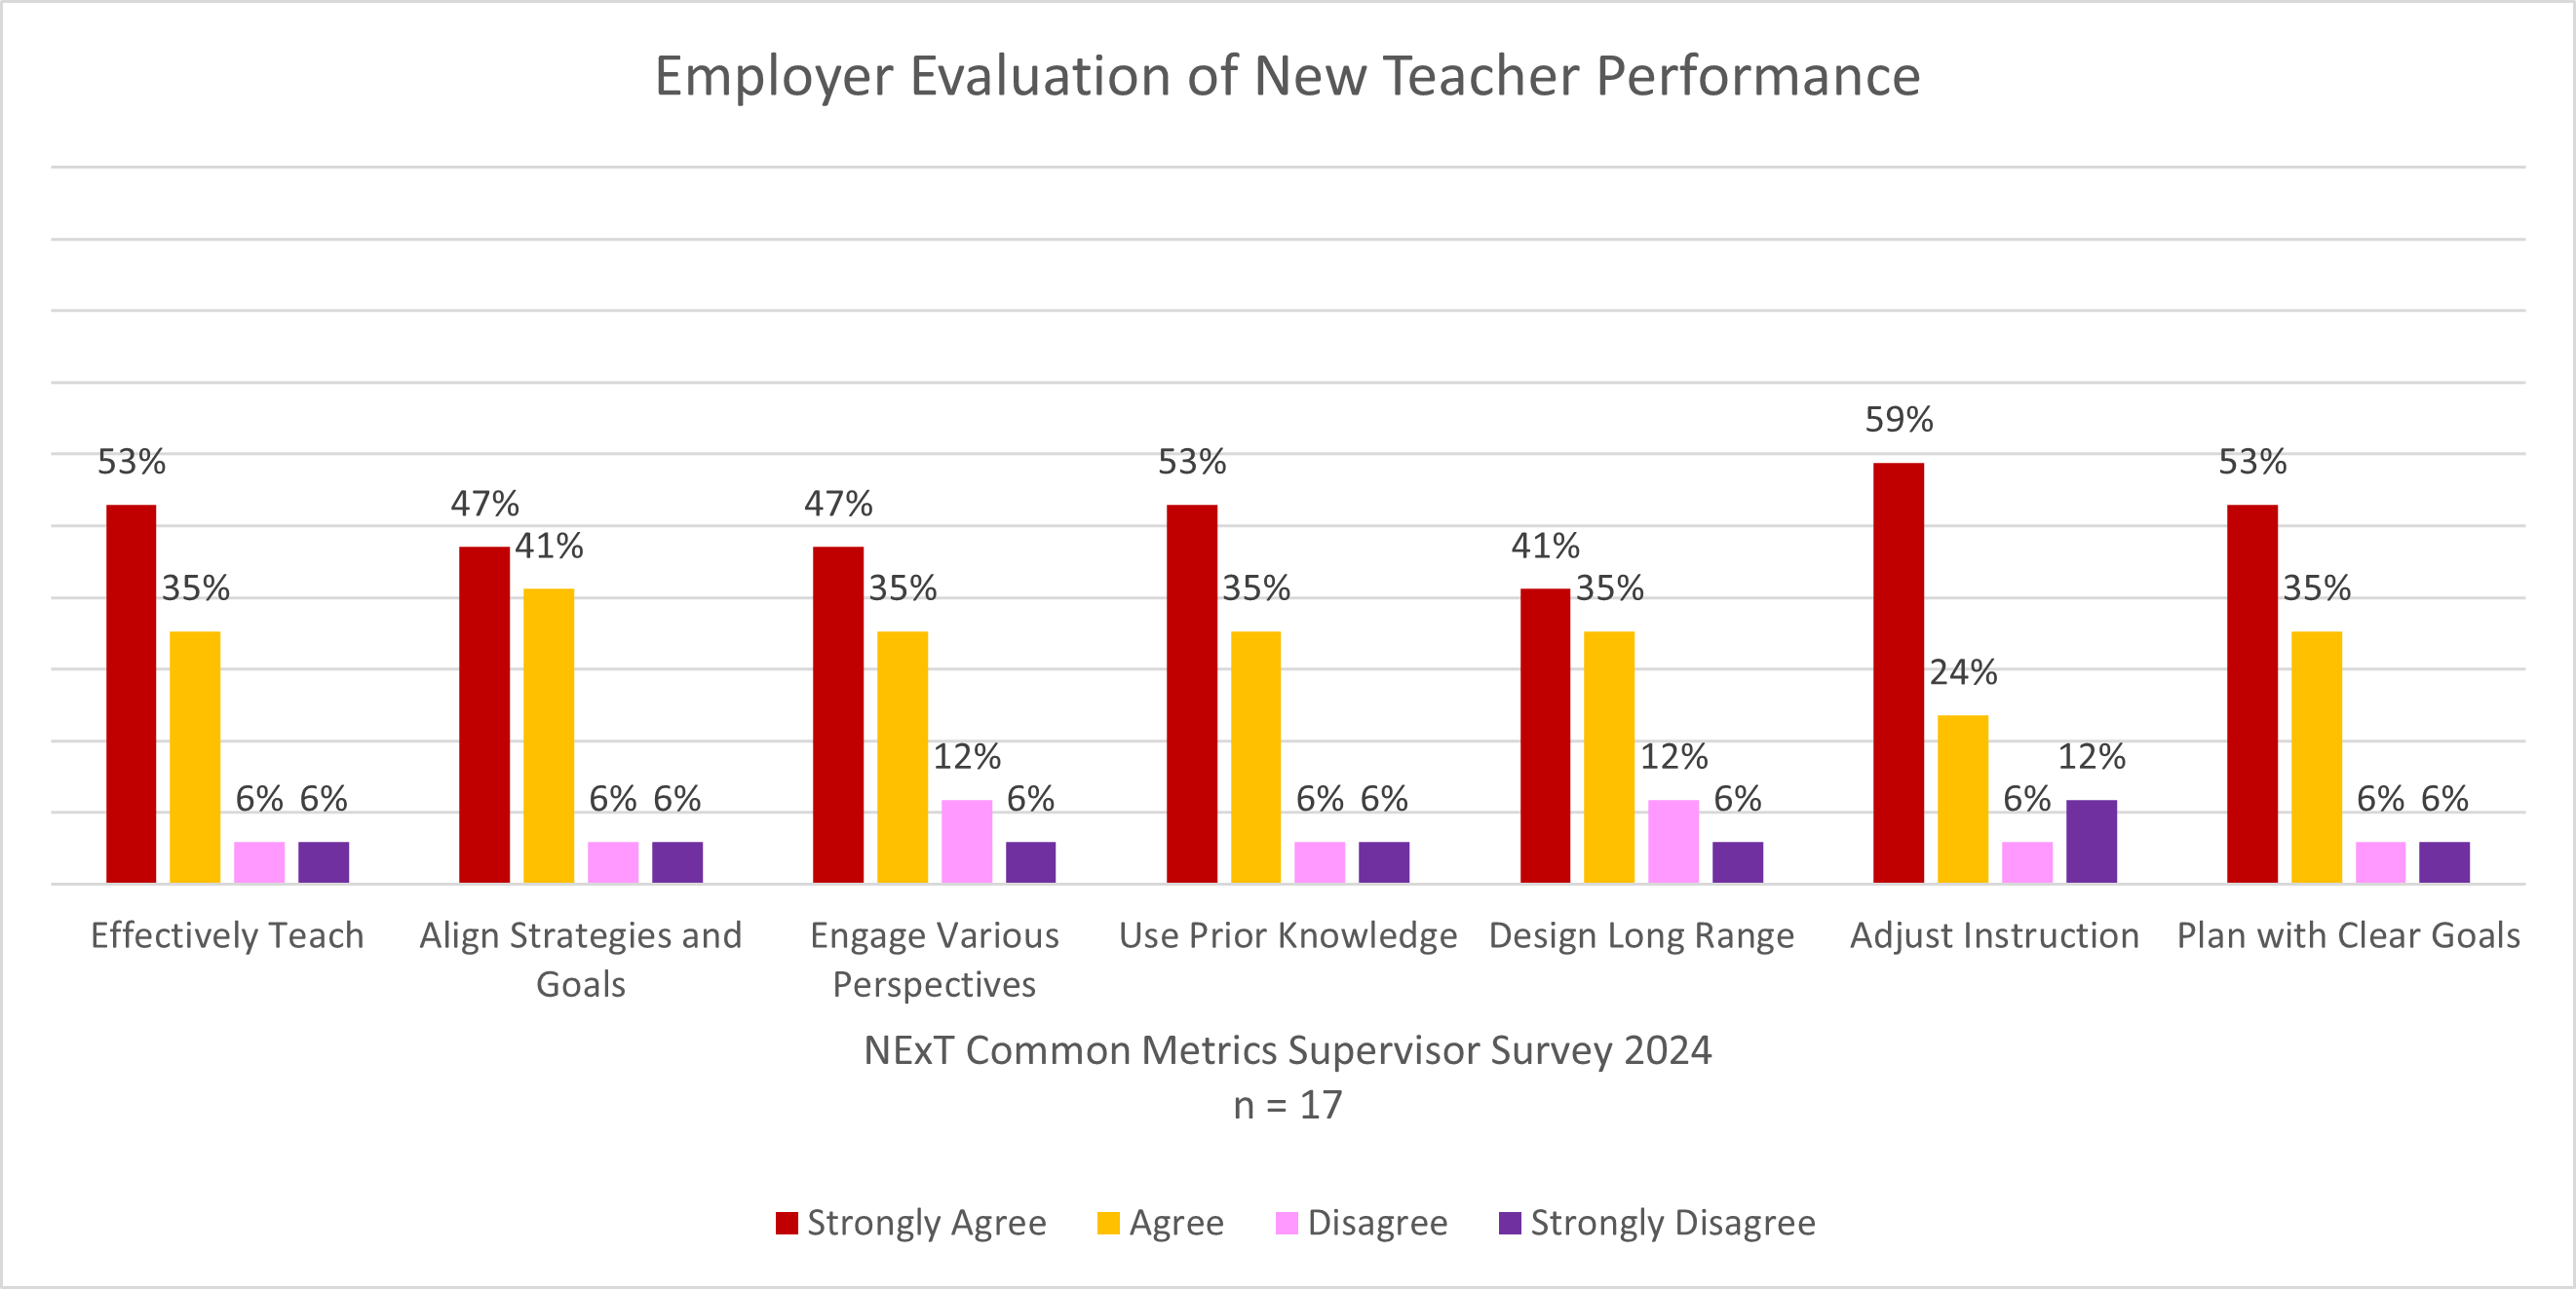
| Employer Evaluation of New Teacher Performance | ||||
| Strongly Agree | Agree | Disagree | Strongly Disagree | |
| Effectively Teach | 53% | 35% | 6% | 6% |
| Align Strategies and Goals | 47% | 41% | 6% | 6% |
| Engage Various Perspectives | 47% | 35% | 12% | 6% |
| Use Prior Knowledge | 53% | 35% | 6% | 6% |
| Design Long Range | 41% | 35% | 12% | 6% |
| Adjust Instruction | 59% | 24% | 6% | 12% |
| Plan with Clear Goals | 53% | 35% | 6% | 6% |
Measure 2: Satisfaction of Employers and Stakeholder Involvement (R4.2, R5.3, and RA4.1)
Initial Licensure Programs
The college administers the Network for Excellence in Teaching (NExT) Supervisor Survey during the spring semester to supervisors of first-year teachers who completed a program at Minnesota State University, Mankato. Supervisors evaluate new teacher competence based on observations and respond to questions about new teacher performance across multiple areas, including working with diverse learners.
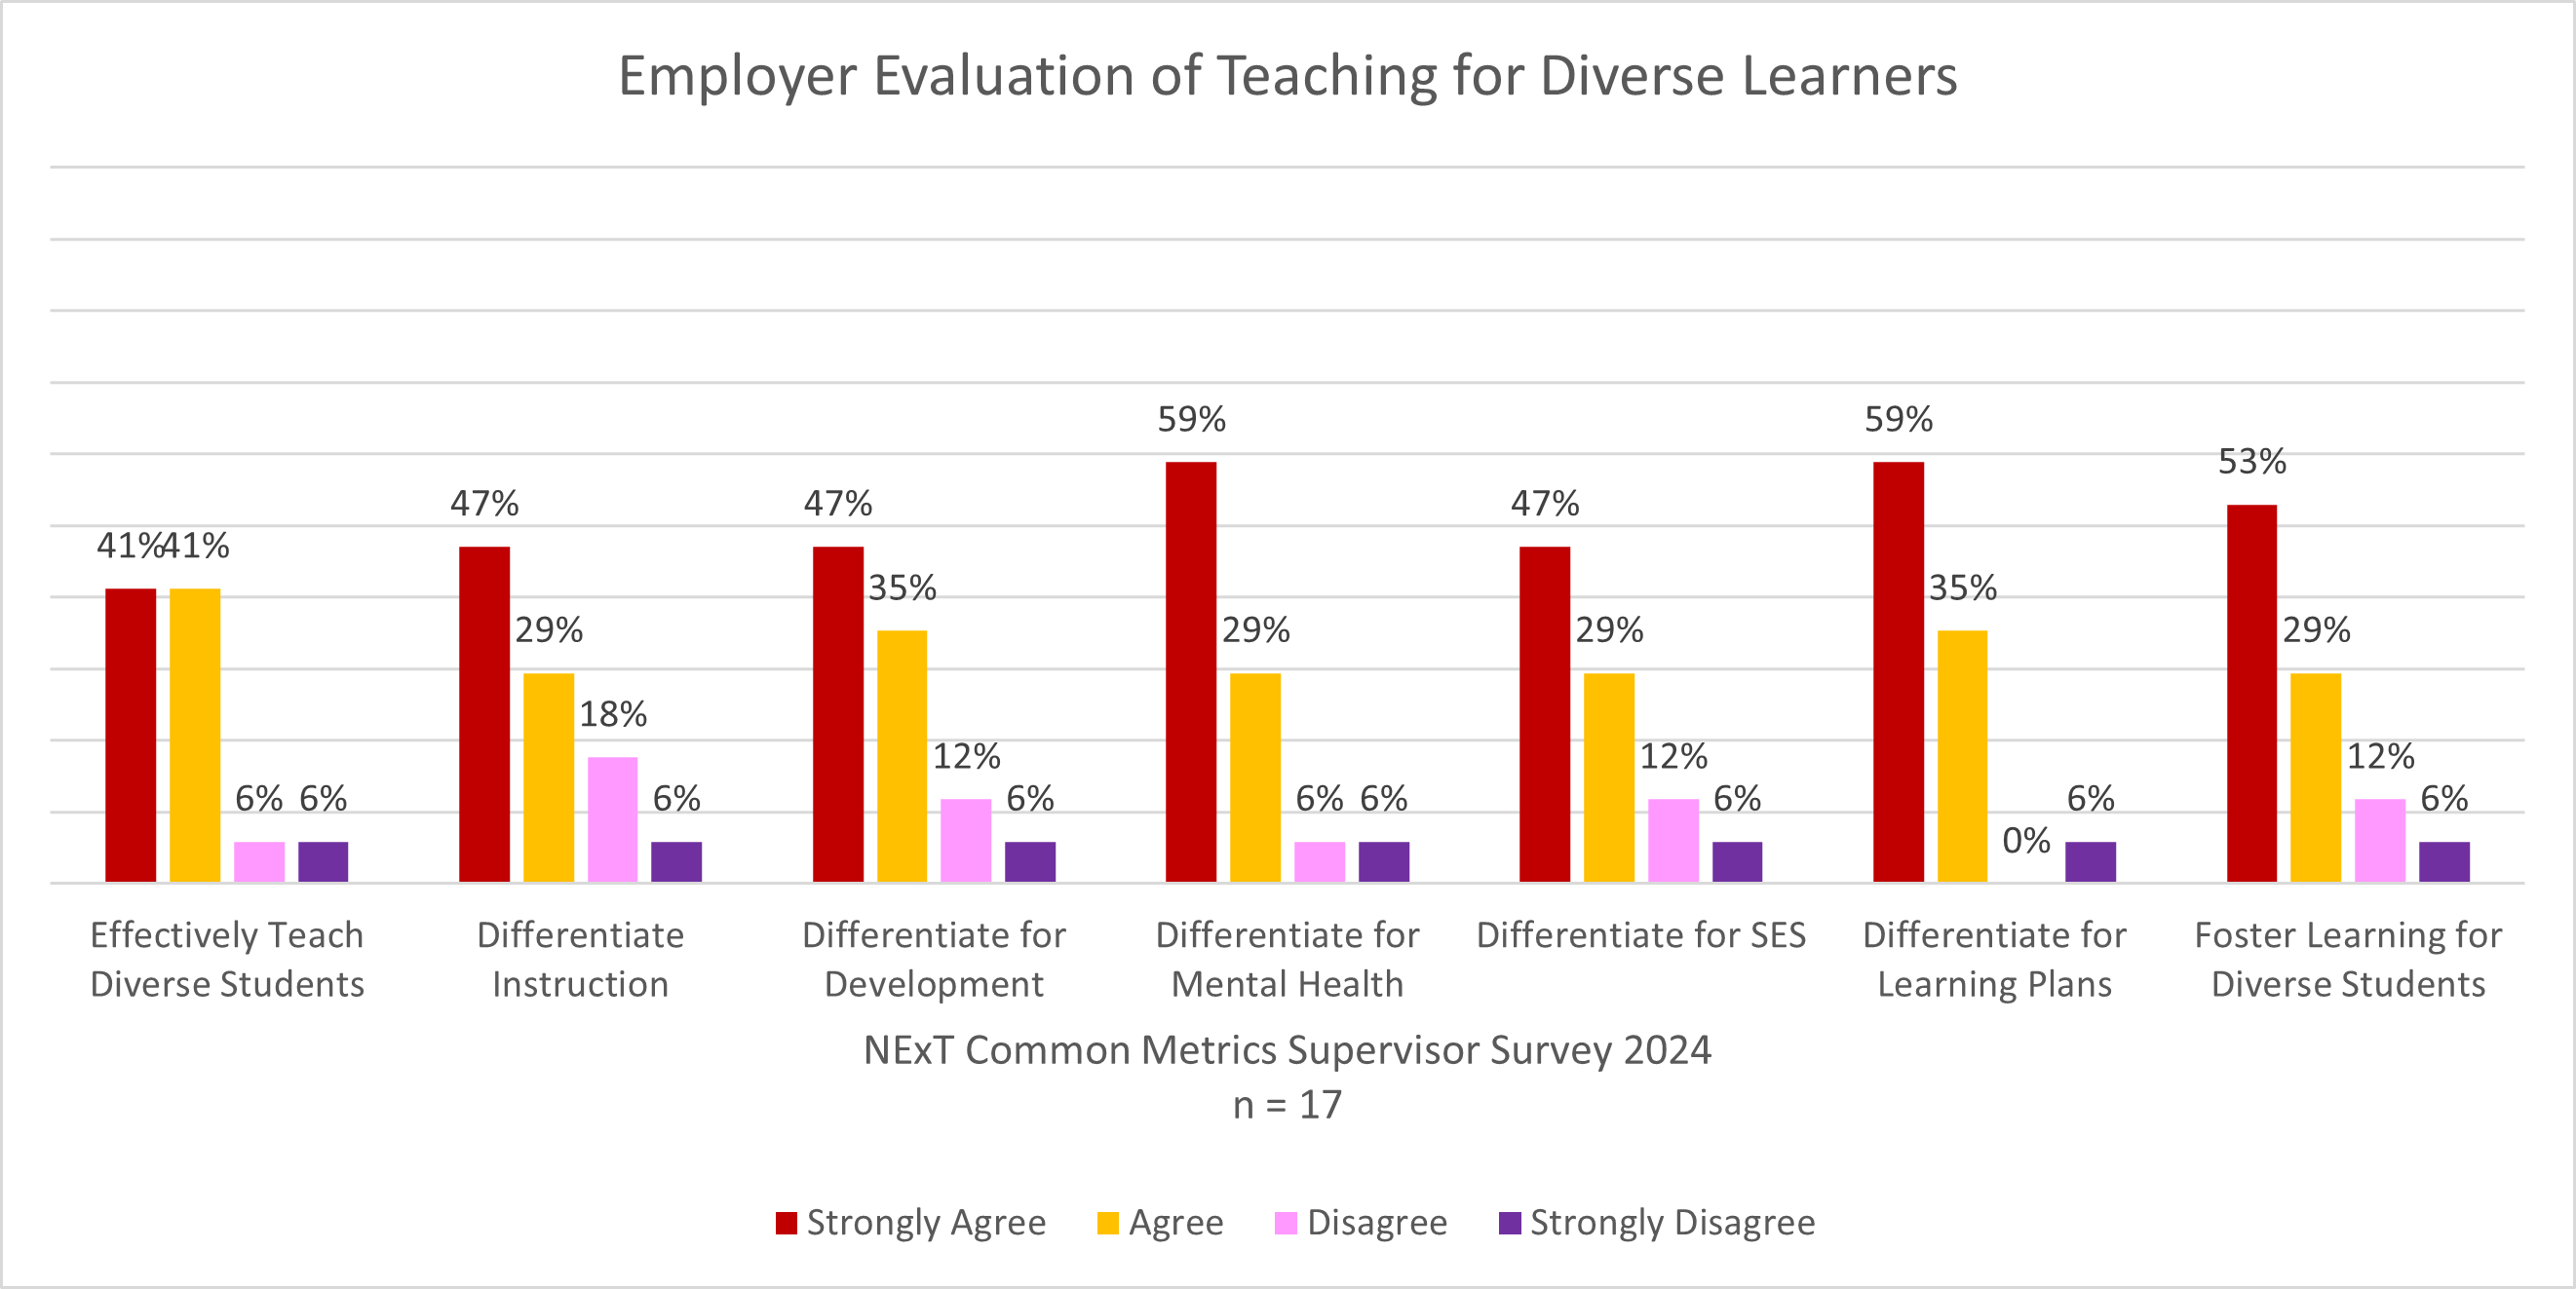
Alt Text: Bar chart showing percentage of responses to seven questions on teaching for diverse learners. The following Employer Evaluation of Teaching for Diverse Leaners table includes the data that is represented in the bar chart.
Employer Evaluation of Teaching for Diverse Learners
Strongly Agree |
Agree |
Disagree |
Strongly Disagree |
|
|---|---|---|---|---|
Effectively Teach Diverse Students |
41% | 41% | 6% | 6% |
Differentiate Instruction |
47% | 29% | 18% | 6% |
Differentiate for Development |
47% | 35% | 12% | 6% |
Differentiate for Mental Health |
59% | 29% | 6% | 6% |
Differentiate for SES |
47% | 29% | 12% | 6% |
Differentiate for Learning Plans |
59% | 35% | 0% | 6% |
Foster Learning for Diverse Students |
53% | 29% | 12% | 6% |
Advanced Licensure Programs
Data for Measure 2 for advanced licensure programs is unavailable for 2023-24. Advanced licensure programs began collecting this data in 2024-25 and will report the results in the 2026 CAEP annual report.
Measure 3: Candidate Competency at Completion (R3.3)
Initial Licensure Programs
edTPA Pass Rates 2023-24
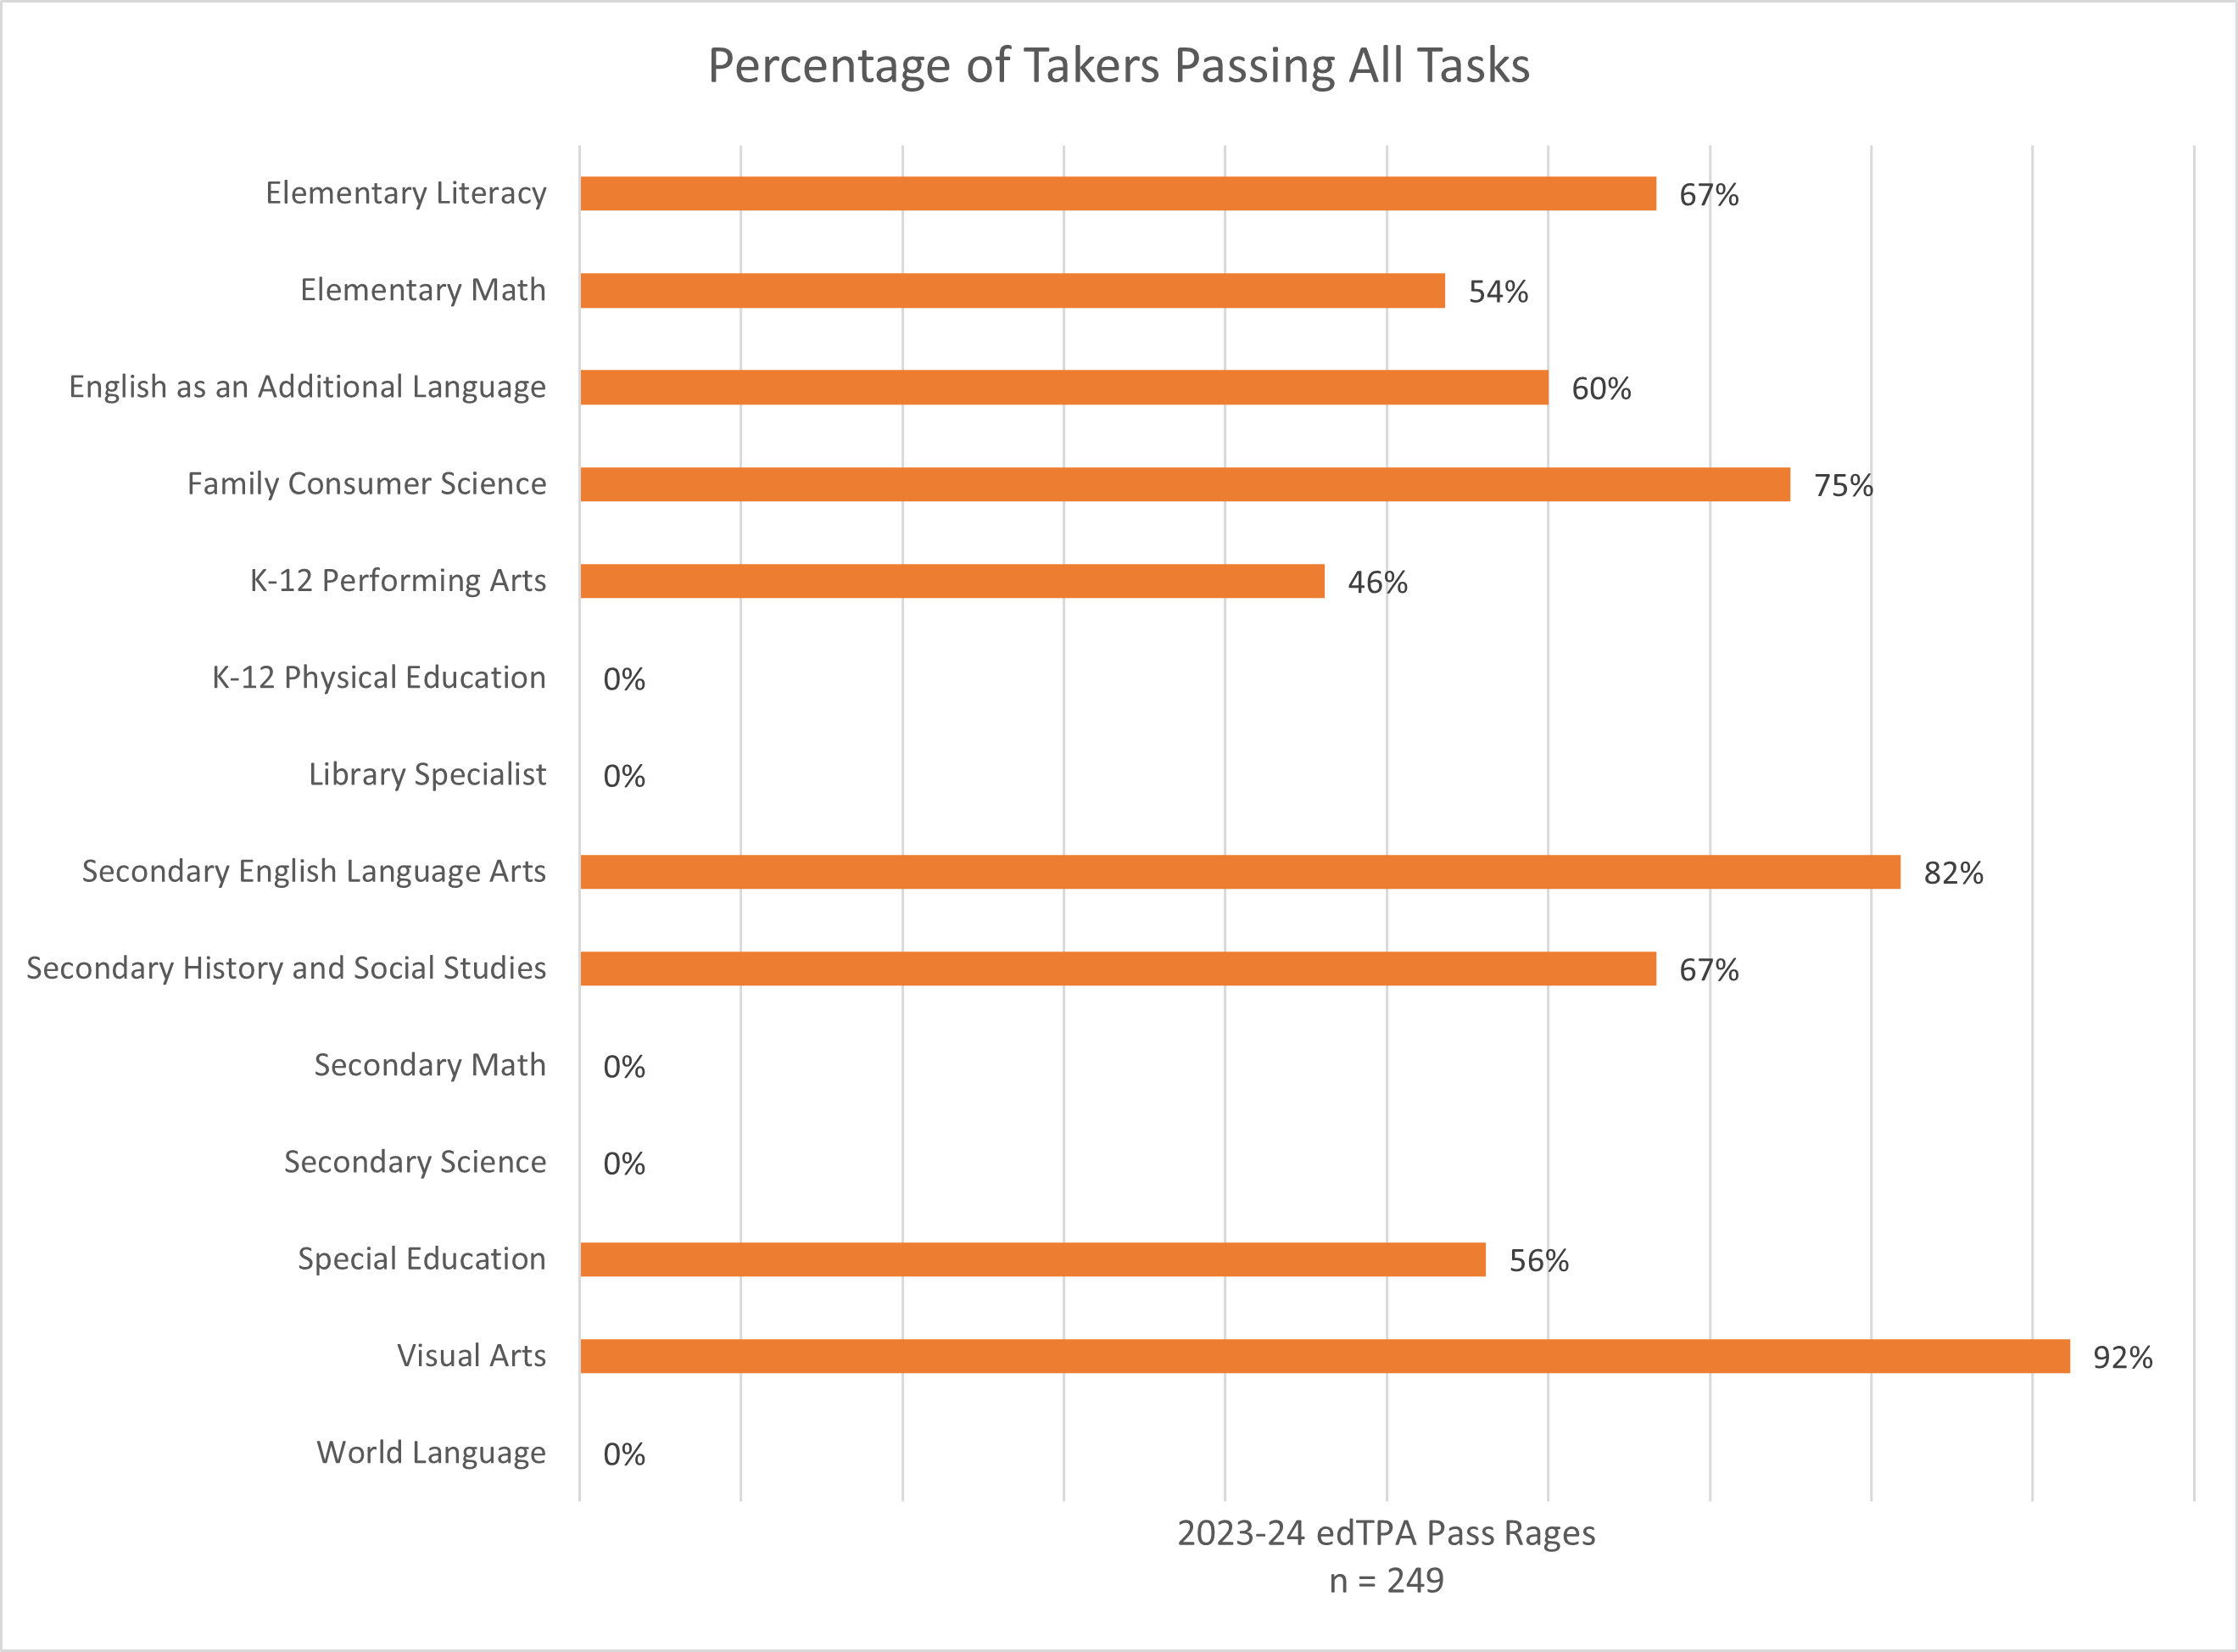
In 2023-24, the following percentages of test takers passed all three edTPA tasks: Elementary Literacy: 67% (n = 36), Elementary Math: 54% (n = 69), English as an Additional Language: 60% (n = 5), Family and Consumer Science: 75% (n = 8), K-12 Performing Arts: 46% (n = 13), K-12 Physical Education: 0% (n = 11), School Librarian/Library Specialist: 0% (n = 1), Secondary English Language Arts: 82% (n = 11), Secondary History and Social Studies: 67% (n = 18), Secondary Math: 0% (n = 1), Secondary Science: 0% (n = 3), Special Education: 56% (n = 57), Visual Arts: 92% (n = 19), World Languages: 0% (n = 1).
Advanced Licensure Programs
Data for Measure 3 for advanced licensure programs is unavailable for 2023-24. Programs began collecting assessment data for advanced licensure programs in 2024-25 and will report that data in the 2026 CAEP annual report.
Measure 4: Ability of Completers to Be Hired in Education Positions for Which They Have Been Prepared
The university administers a Graduate Survey annually to program completers. From this survey, we gather information on the employment status of graduates. The graphs linked below show graduates' status one year after graduation in the following categories: Available Unemployed, Continuing Education, Employed Related, Employed Unrelated Not Seeking Related, Employed Unrelated Seeking Related, Not Available for Employment, and Status Unknown.
Graduate Survey data for the 2023-24 academic year will be collected and reported in August 2025.
Initial Licensure Programs
Employment Status One Year After Graduation by Graduation Year
2018-19 |
2019-20 |
2020-21 |
2021-22 |
2022-23 |
|
|---|---|---|---|---|---|
Employed Related |
90% | 88% | 94% | 97% | 96% |
Employed Unrelated Seeking Related |
8% | 1% | 2% | 0% | 2% |
Available Unemployed |
2% | 11% | 4% | 3% | 2% |
Time to Employment by Graduation Year
Already employed |
Before 3 months |
Between 3 & 6 months |
Between 6 & 9 months |
Between 9 months & 1 year |
|
|---|---|---|---|---|---|
2018-19 |
9% | 30% | 56% | 5% | 0% |
2019-20 |
6% | 19% | 48% | 15% | 12% |
2020-21 |
8% | 18% | 56% | 10% | 4% |
2021-22 |
28% | 34% | 30% | 5% | 7% |
2022-23 |
11% | 47% | 36% | 4% | 2% |
Advanced Licensure Programs
Employment Status One Year After Graduation by Graduation Year |
|||||
2018-19 |
2019-20 |
2020-21 |
2021-22 |
2022-23 |
|
Employed Related |
98% | 97% | 98% | 98% | 99% |
Employed Unrelated Seeking Related |
0% | 0% | 1% | 0% | 0% |
Available Unemployed |
2% | 3% | 1% | 1% | 1% |
Time to Employment by Graduation Year |
|||||
Already employed |
Before 3 months |
Between 3 & 6 months |
Between 6 & 9 months |
Between 9 months & 1 year |
|
2018-19 |
35% | 5% | 55% | 1% | 3% |
2019-20 |
50% | 2% | 33% | 3% | 13% |
2020-21 |
48% | 7% | 41% | 1% | 3% |
2021-22 |
39% | 33% | 21% | 2% | 74% |
2022-23 |
54% | 34% | 8% | 1% | 2% |